Equity & Options
Market Research, Analysis
& Strategies

is the premier site for active option and equity traders offering real time coverage of markets via options activity alerts, technical set-ups, breaking news, in-depth research and much more.


Set-Ups

Talk

Weekly
market
View
The SPX closed lower by about -2% on the week after a series of short covering bursts saw the index rally off support of 5150 but ultimately making a lower high each time and then seeing risk culminate Friday in a minor panic selloff which closed right near our options expected move lower bound for the week. VIX call volume also spiked notably Friday to 1.8M calls traded, showing substantial fear and being the most calls on the volatility index in over 5 years. The SPX now enters April monthly OPEX week and with headline risk clearly driving moves, caution is still warranted. Downside levels now in play are the 5100 SPX support with the 55-day MA just below here at 5077 as a likely test. Any close below there would open up a volume pocket to further test into the round number magnet of 5000 which lines up with large support at the YTD VWAP level on SPY near 500 as the chart shows below. The SPY chart also shows the volume profile visually where open gap would fill near 497 from the mid-February gap up rally. A very likely spot to see prices test if markets weaken further. Sell signals have mounted for two weeks now as MACD continues to be in bear mode along with lower lows in RSI and the NYSI breadth signal confirming risk potential. Overall this is well overdue from an extended rally in Q1 that went well above where most anticipated and the typical Spring time correction in markets will offer up opportunities after a healthy reset of sentiment as earnings season begins.

Market Sentiment/Breadth
AAII sentiment for the week ending 4/10 showed bullish responses fall to 43.4% from 47.3% prior while bearish responses increased to 24.0% from 22.2%. Neutral sentiment rose to 32.5% from 30.5%. The bull-bear spread (bullish minus bearish sentiment) decreased 5.7 percentage points to 19.4%. The bull-bear spread is above its historical average of 6.5% for the 23rd consecutive week. The NAAIM Exposure index decreased to 81.92 from 84.24 last week and is just below last quarter’s average of 87.84. Total equity fund flows for the week ending 4/3 had $-14.5 billion of outflows in equities. Friday’s close saw NYSE new highs at 64 while new lows of 60 and the 10-day MA of New High/Low Differential is falling but still positive at +87. The percentage of SPX stocks above their 50-MA is at 44.4% and now into 5 month lows while those above their 200-MA was 71.8%. NYSI Summation index crossed below its 8-MA for a short term sell signal. NYMO McClellan Oscillator closed at -75 and now near oversold. The cumulative AD line decreased this week and is slipping under the 40 EMA short term breadth trend while still well above the 89 EMA long term bull signal. CBOE Equity P/C 50-day MA at 0.64. CNN Fear and Greed index is in the Neutral zone at 46 from 61 last week. The VIX/VXV ratio closed at 0.951. This measures the spread between 1- and 3-month implied volatility, above 1.0 exhibits fear and tends to mark a low.
Open
Interest
Alerts
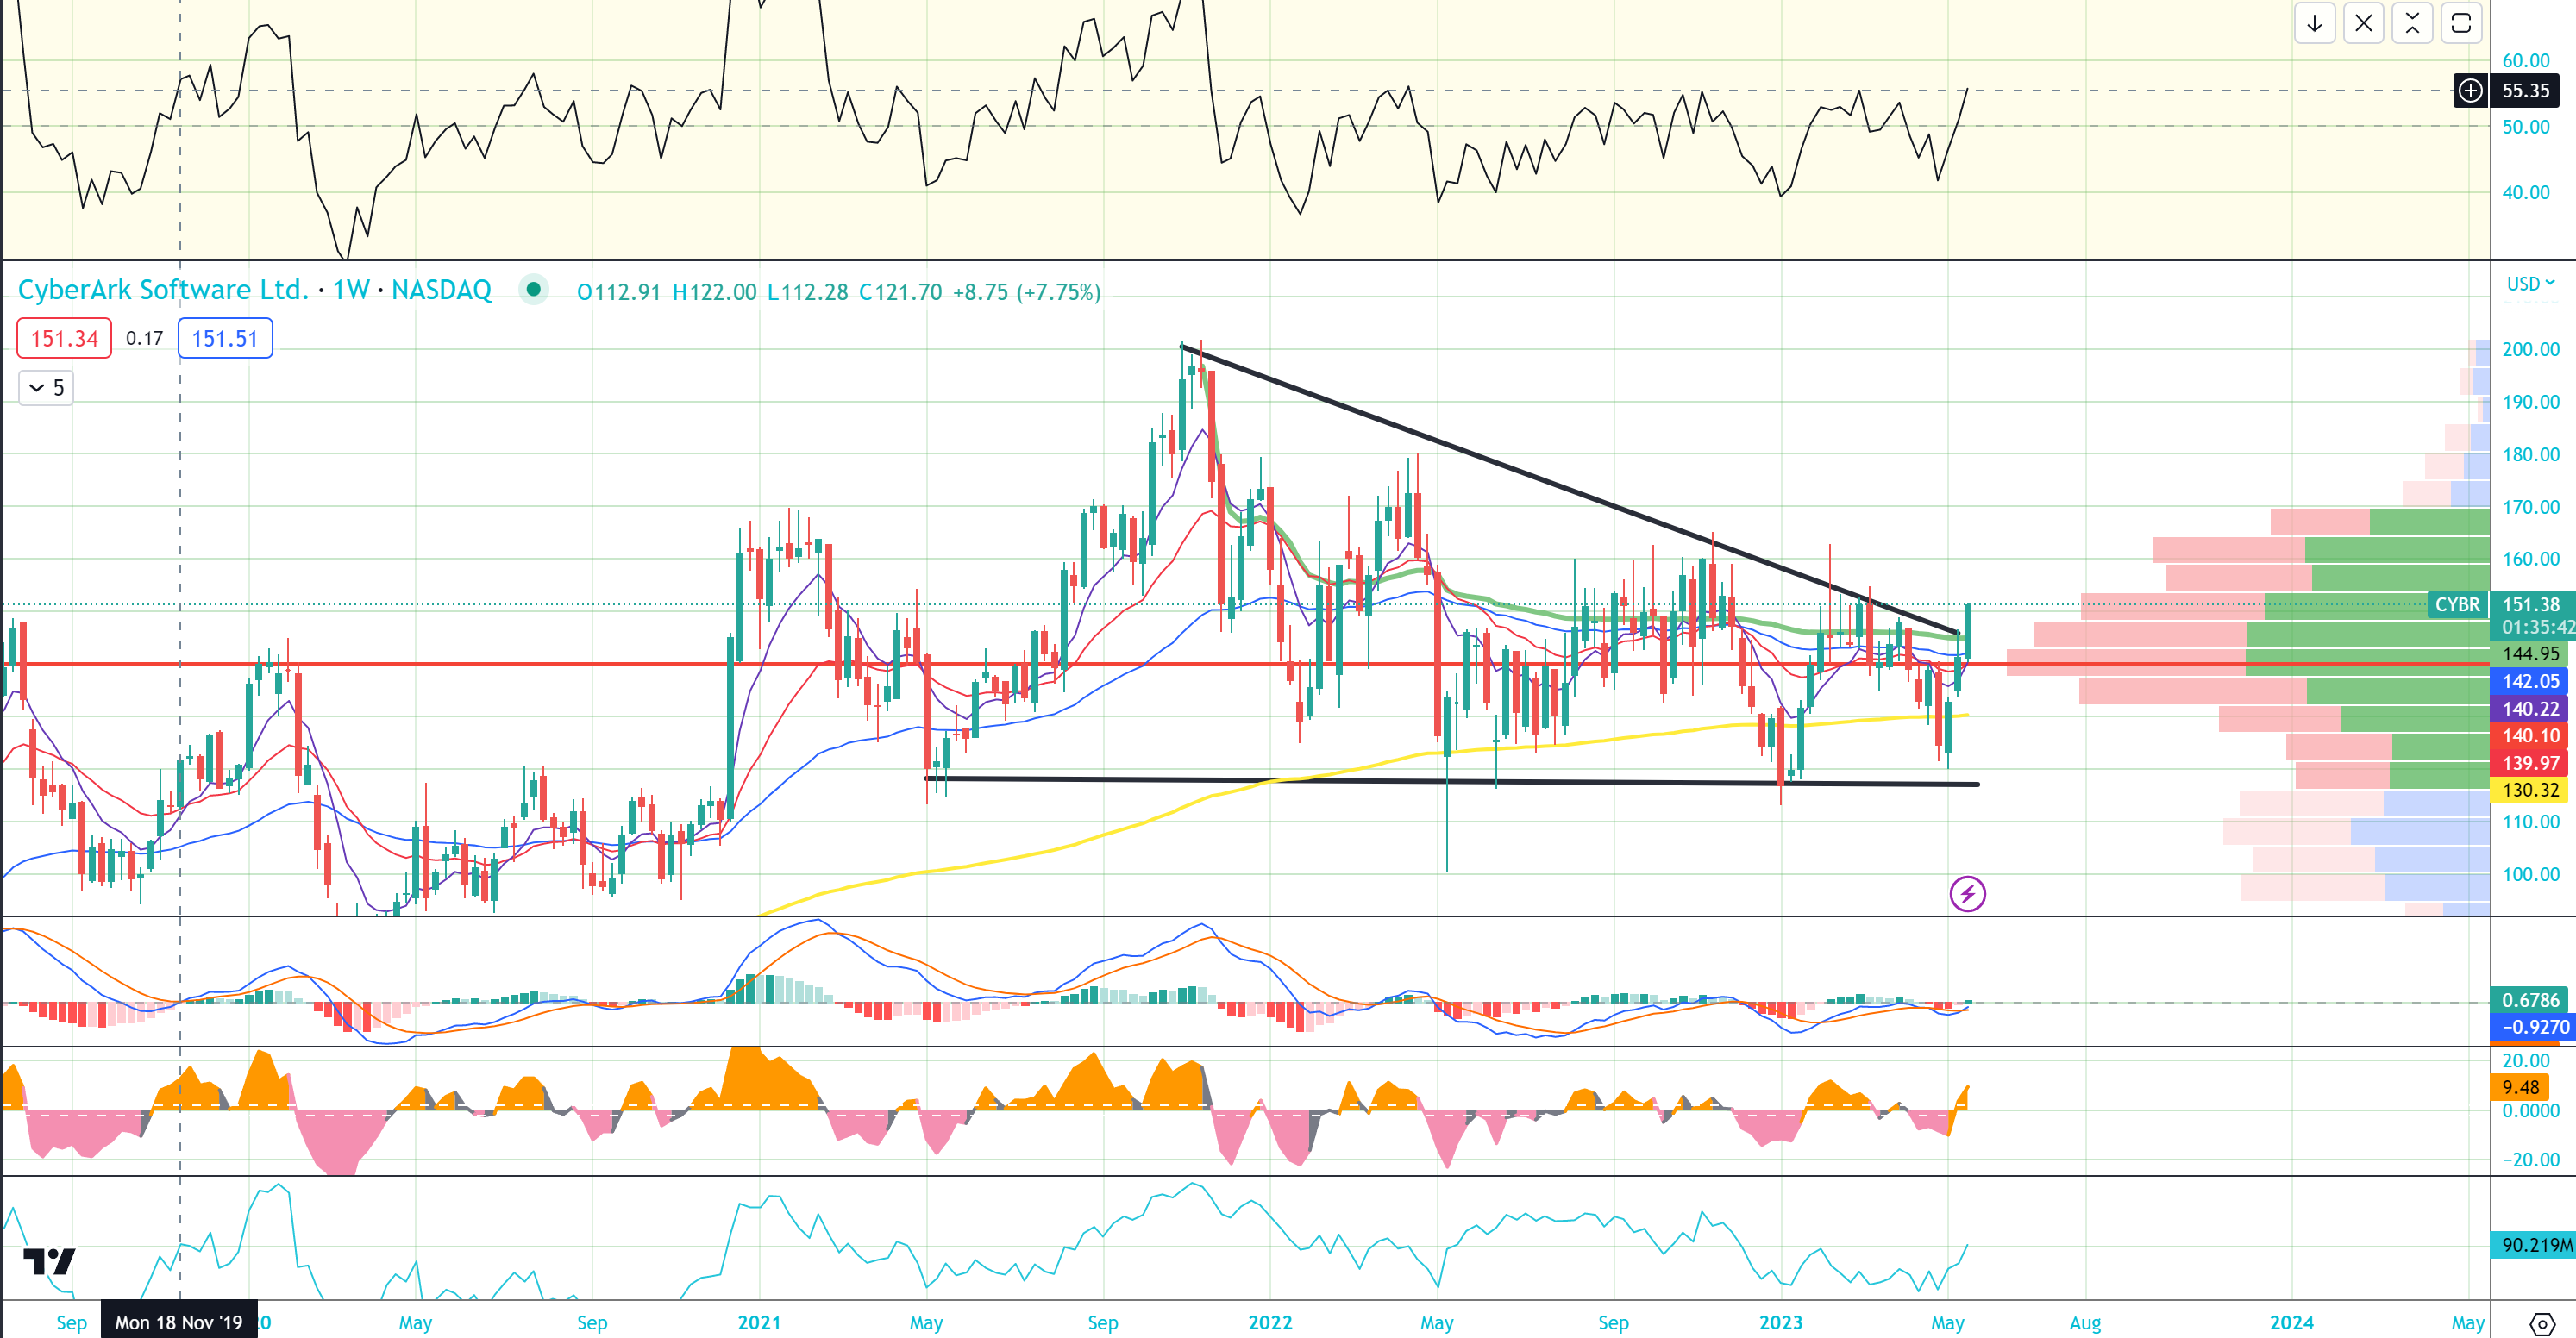
CyberArk (CYBR) on 4/17 with an unusual buy of 1000 December 2024 $160/$230 call spreads and a lot of earnings reports due from the group the next two weeks while M&A remains a key theme to the group.
CYBR shares are on a third week of a rally working over VWAP from record highs, triggering a bull weekly MACD cross and weekly RSI to the highest level in 18-months while shares show a major long-term trend inflection. The $160 level is the next challenge and above that the $120/$160 range break measures to $200. Shares are also working on a massive monthly bull engulfing candle.
Chart
Set-Ups
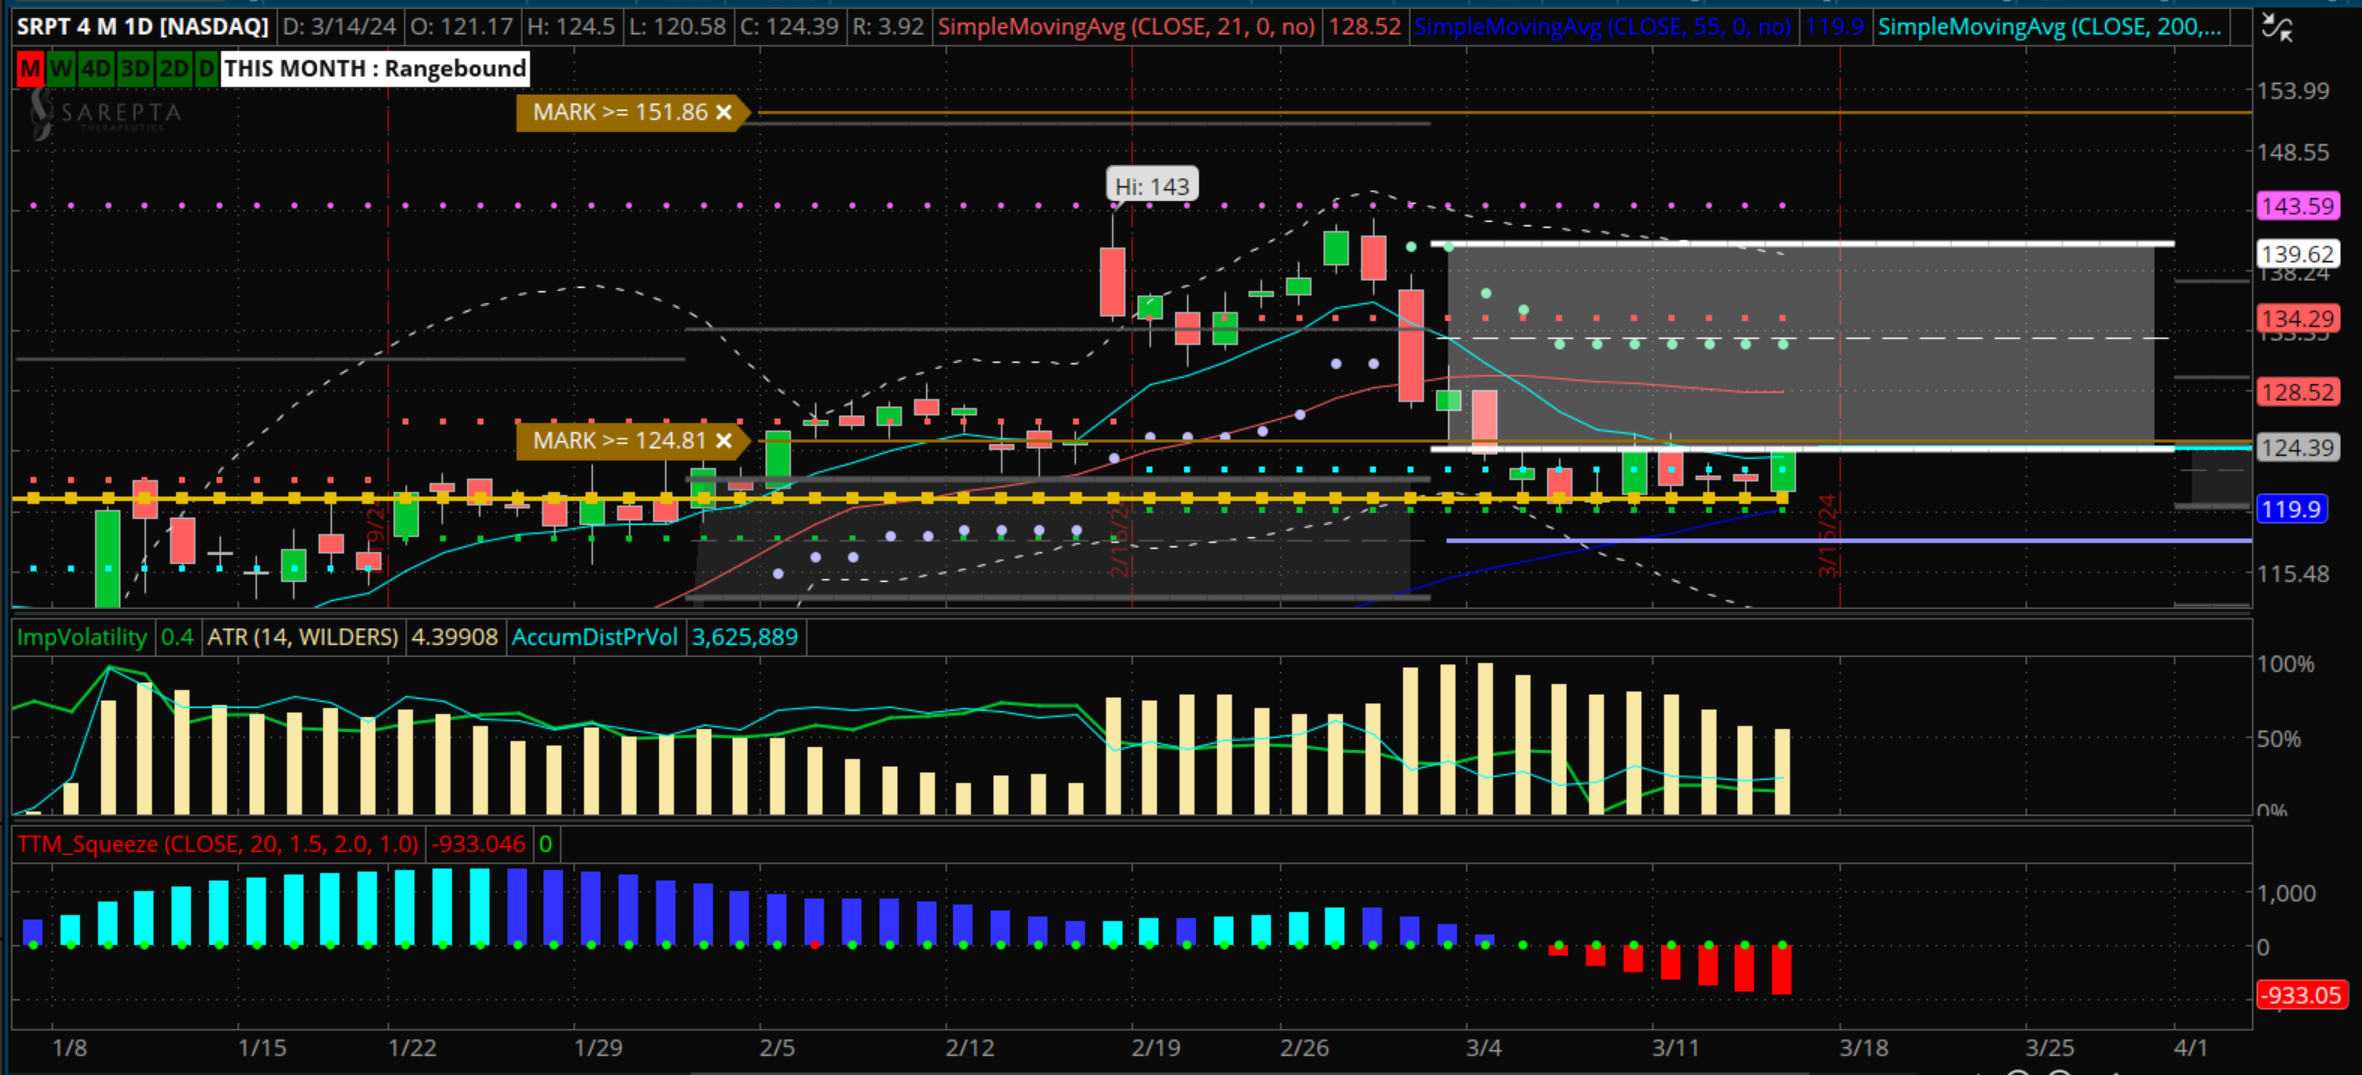
SRPT Bio with rel. strength today and recent upside call spread buys in size, held right on 1-year VPOC and now trying to clear 8-MA and back inside value, over 125 should lead to nice run higher
Market
Talk
Stocks were weak overnight on negative China trade data and further talks of an Israel/Iran conflict while commodities surged in early trade, both energy and metals. The first batch of Bank earnings came in with mixed receptions. Breadth was ugly the opening thirty and Consumer Confidence missed expectations. The high was at the falling 8MA and then stocks rolled over harder to SPY 512 key level. Metals and Energy were really the only groups green. Downside was led by risk-on groups like Semis, Solar and Biotech. Next week earnings will pick up and although the Macro schedule is lighter, heightened volatility remains with a downside in markets since the bearish NYSI cross just over a week ago.
The stock market closed with solid losses this week. Market participants had a lot to digest on this busy week in terms of market-moving events. The downside bias was driven by a jump in market rates, a recalibration of rate cut expectations, and increased geopolitical tensions. The added sticking point for the geopolitical angst, which was related to reports that Iran could soon attack Israel, was uncertainty related to the weekend and the potential that investors would not be able to react in real-time to any potential developments.
What’s On Tap: The earnings schedule picks up with key reports due from ASML, UNH, PG, JNJ, NFLX, BAC, ABT, AXP, BX, MS, ISRG, GS, SCHW, ELV, PLD, MMC, SLB, CSX, PNC, TRV, DHI, CCI, LVS, PPG, DFS and many more. In Macro, Retail sales on Monday, Industrial production Tuesday, Beige Book Wednesday, Philly Fed on Thursday and April options expiration on Friday.
Flow
Recap/
Highlights
The start of the week of 4/8 saw an early interesting theme was Defense call buys for August seen with NOC, RTX, LDOS into rising geopolitical tensions. Then AVAV, LMT and KTOS saw unusual July call buys. By midweek Bullish put selling remains active in gold miners and nuclear-focused Utilities. Bull flows continued in Defense names into late in the week and by Friday we saw AMZN, TSLA, META mega caps saw some adjustments out to June and December 2026 positions, a bullish sign longterm.
OptionsHawk

OptionsHawk is the premier site for active investors
We provide real time coverage of the market via options activity alerts, fundamental research, breaking news, technical set-ups and alerts, earnings strategies, sell-side commentary and much more. We provide a full suite of research and analysis to allow investors to make better informed decisions.
Our Mission
OptionsHawk is an idea generation and research platform providing accurate, unique, and high quality analysis of the equity and options market in real time. OptionsHawk aims to be the premier community for traders and investors as we simplify and maximize the efficiency of your research process while also handpicking and presenting the best ideas based on our many years of experience in a concise and timely manner.
Our Process
We integrate all methods into our process to give the most thorough assessment of a company, which includes fundamentals, technicals, institutional option and equity flows, management commentary, Macro views, catalyst discovery, and sell-side research.
Our Vision
The Hawk symbolizes the ability to use intuition and higher vision in order to complete tasks or make important decisions. Hawks also encourage you to use laser focus and precision to get things done, and to take the lead in life. The hawk represents focus, strength, and poise, and as messengers to learn powerful lessons or expand your knowledge and wisdom. The Hawk encapsulates our company vision.
Browse and Compare Options Hawk Products