Advanced Butterfly Spread Trading
My previous post on Butterfly Option Spreads went over the basics of how to create a butterfly and when they are best used. Now let’s look deeper into the many options for alternative butterfly strategies to see just how flexible options really are. As we know the standard butterfly consists of 3 strike prices being used in the same expiration date and these strikes are equidistant apart. The structure has a 1x2x1 quantity whereas the center strike has two options sold for every one option that is bought on the wings. But if you wanted to do a variation of these structures based on your price outlook for the stock then you might vary the distance between one of the strike prices or perhaps add more contracts to one side of the butterfly. A few of the advanced ways to structure butterfly options spreads includes the broken wing fly, the unbalanced fly, and the skip strike butterfly for a credit.
Options offer traders a great deal of flexibility to craft a position with unique reward-to-risk characteristics so having more butterflies to choose from will always help you attain a higher probability of success no matter what type of market environment you encounter. The great part about using options is the ability to create a trade based on what type of magnitude or speed you assume the stock or market to make. As always when using a new option strategy for the first time it’s best to trade it with a small position size and focusing on learning the process of understanding the unique characteristics of the trade.
Butterfly Spread Variations
- Broken Wing Butterfly
- Skip Strike Butterfly (for credit)
- Unbalanced Butterfly
Broken Wing Butterfly
The broken wing fly is a great alternative to the traditional butterfly that is equal distance between each strike price. The main difference is that you have the further out strike closer to the middle strike than your first strike is. So if trading a long call broken wing butterfly (BWB) spread you are paying a net debit and eliminating risk from one side. This of course leads to the other side having more risk and making this a slightly more directional trade than the standard butterfly. For example, on a $100 stock you would buy a call at the 100 strike price, sell two calls at 110, and buy a call at 115. The 100/110/115 butterfly structure would be uneven and thus you are “breaking a wing” on the upside. Since you bought the 115 call strike instead of the equidistant 120 strike, you will pay a little larger debit to enter but in return you have zero upside risk and still make something if the stock blows through the upper bound of the butterfly. This is not the case with a standard fly as you would need the stock to settle in between your strikes you bought to be profitable.
Directional Lean: Moderate Directional Anticipation of Stock Movement
Best Market Environment: High Implied Volatility
Ideal Setup: Into a Catalyst like Earnings report
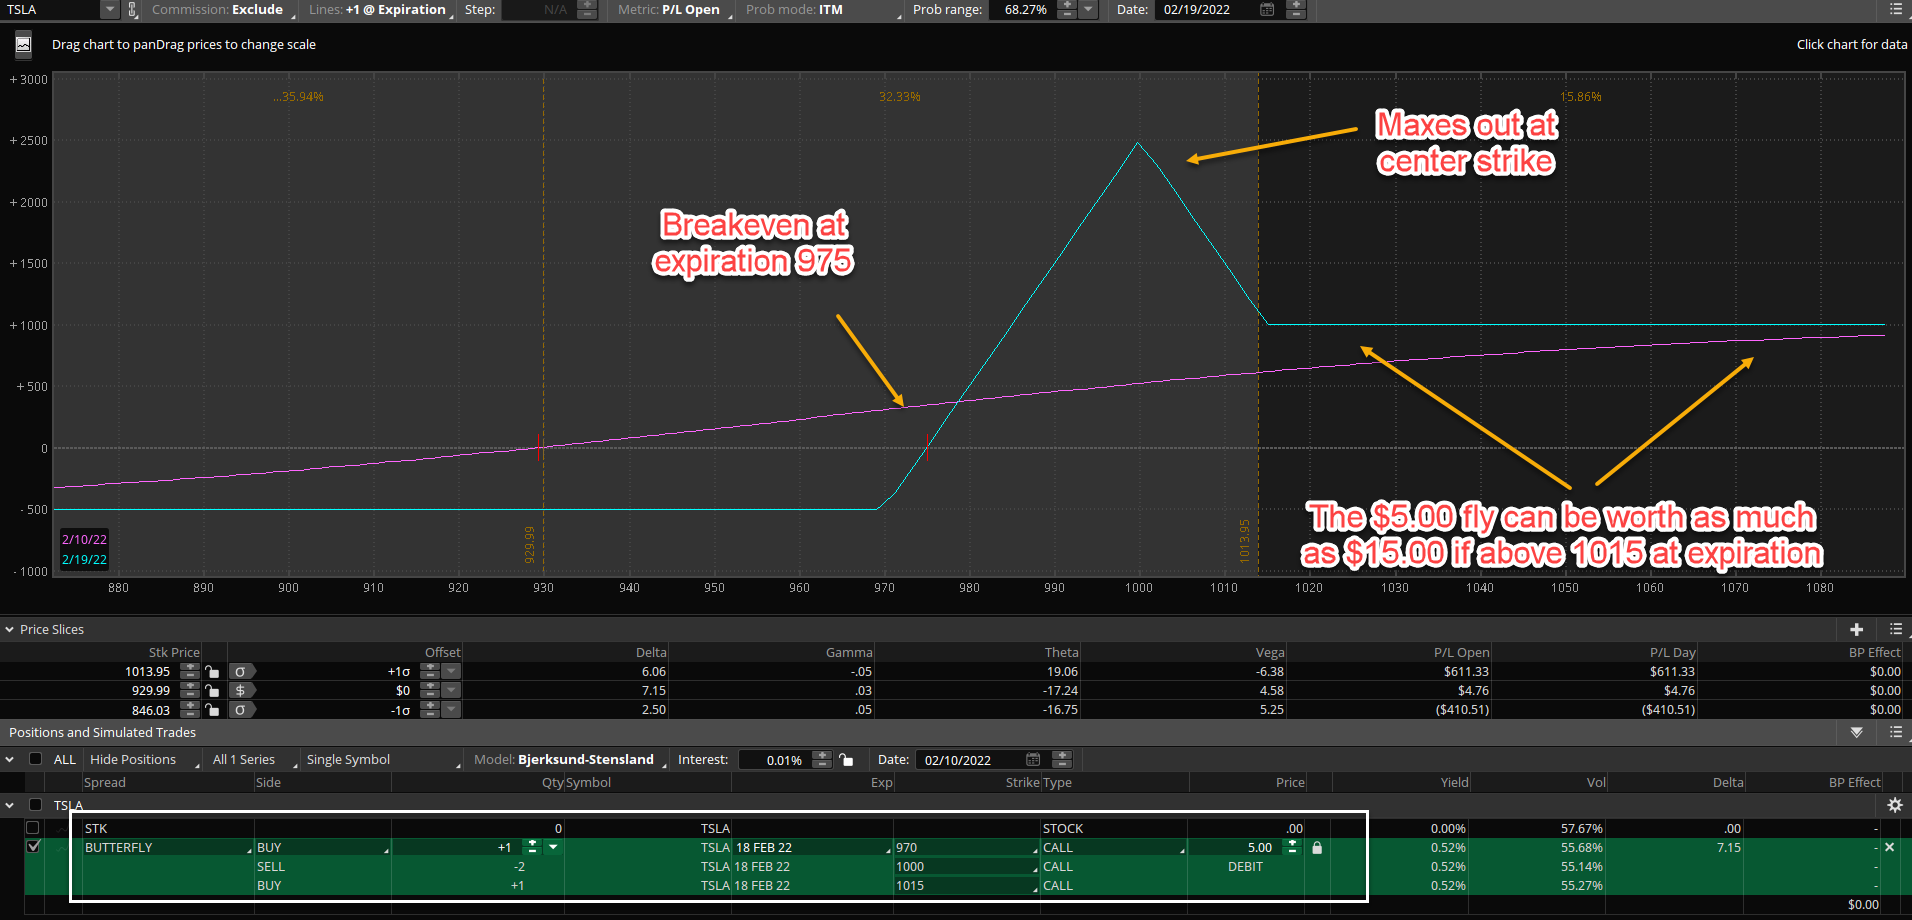
The broken wing fly example below shows how the risk graph would look on TSLA if we bought a 970 call, sold two 1000 calls, and bought one 1015 call. The width between 970 and 1000 is thirty points but then our width between 1000 and 1015 is just fifteen. We are breaking the wing on the upside and creating a larger profit zone while still having a “sweet spot” in the center near 1000 where the most profit is potentially achieved. This is an example of a February broken wing fly with 10 days until expiration. The net debit being $5.00 per spread. Since it’s a butterfly that is out of the money currently with the stock near 935, it would require a swift move higher into the 970+ zone before expiration.
Since the top side of the fly is 15 points wide, that is also the max profit on the upside if the stock blows past the middle strike and closes above 1015 (our upper strike) at expiration. The breakeven as shown at expiration is at 975 since that is equal to the first strike we bought plus the debit paid of $5.00. The pink line shows the profit graph today so it’s more linear and long biased. It’s only closer to expiration or near the middle strike of the structure that it begins to flatten out and benefit from theta decay and IV crush. This is also why these broken wing flies are good to use into earnings reports that you have a bias to one direction but are unsure how far the stock may go but also know IV will decline.
Skip Strike Butterfly (for credit)
The next type of butterfly I like to use is very similar to the first one but instead of breaking one wing of the butterfly spread, you are going to “skip a strike” in the structure. So If you buy strike price A, sell 2 of strike price B, skip strike price C, and then buy strike price D. This can also technically be called a broken wing but you are just structuring the wings of the butterfly differently so the profit and loss risk graph is much different. It’s much easier to understand visually so the example below with NVDA will illustrate. You are ideally doing this skip strike butterfly into an extreme move and expecting the stock to fade or reverse but if it stays sideways and even drifts slowly the trade benefits form a contraction of implied volatility and time passing. This trade is best done for a credit or small debit so you still make something on a flat move or at least don’t lose big. This makes the skip strike butterfly a very high probability trade but more of a lower profit potential. It really comes down to how you structure your strike prices since that will impact your delta exposure most. The further away you position your last strike the more it will reflect a 1×2 ratio spread. After a butterfly is just a ratio spread with an extra call purchased out of the money to cut down the cost of margin requirement.
Directional Lean: Neutral to Bullish for Put Fly and Neutral to Bearish for Call Fly
Best Market Environment: High Implied Volatility
Ideal Setup: Into a Directional Move you expect to fade or reverse
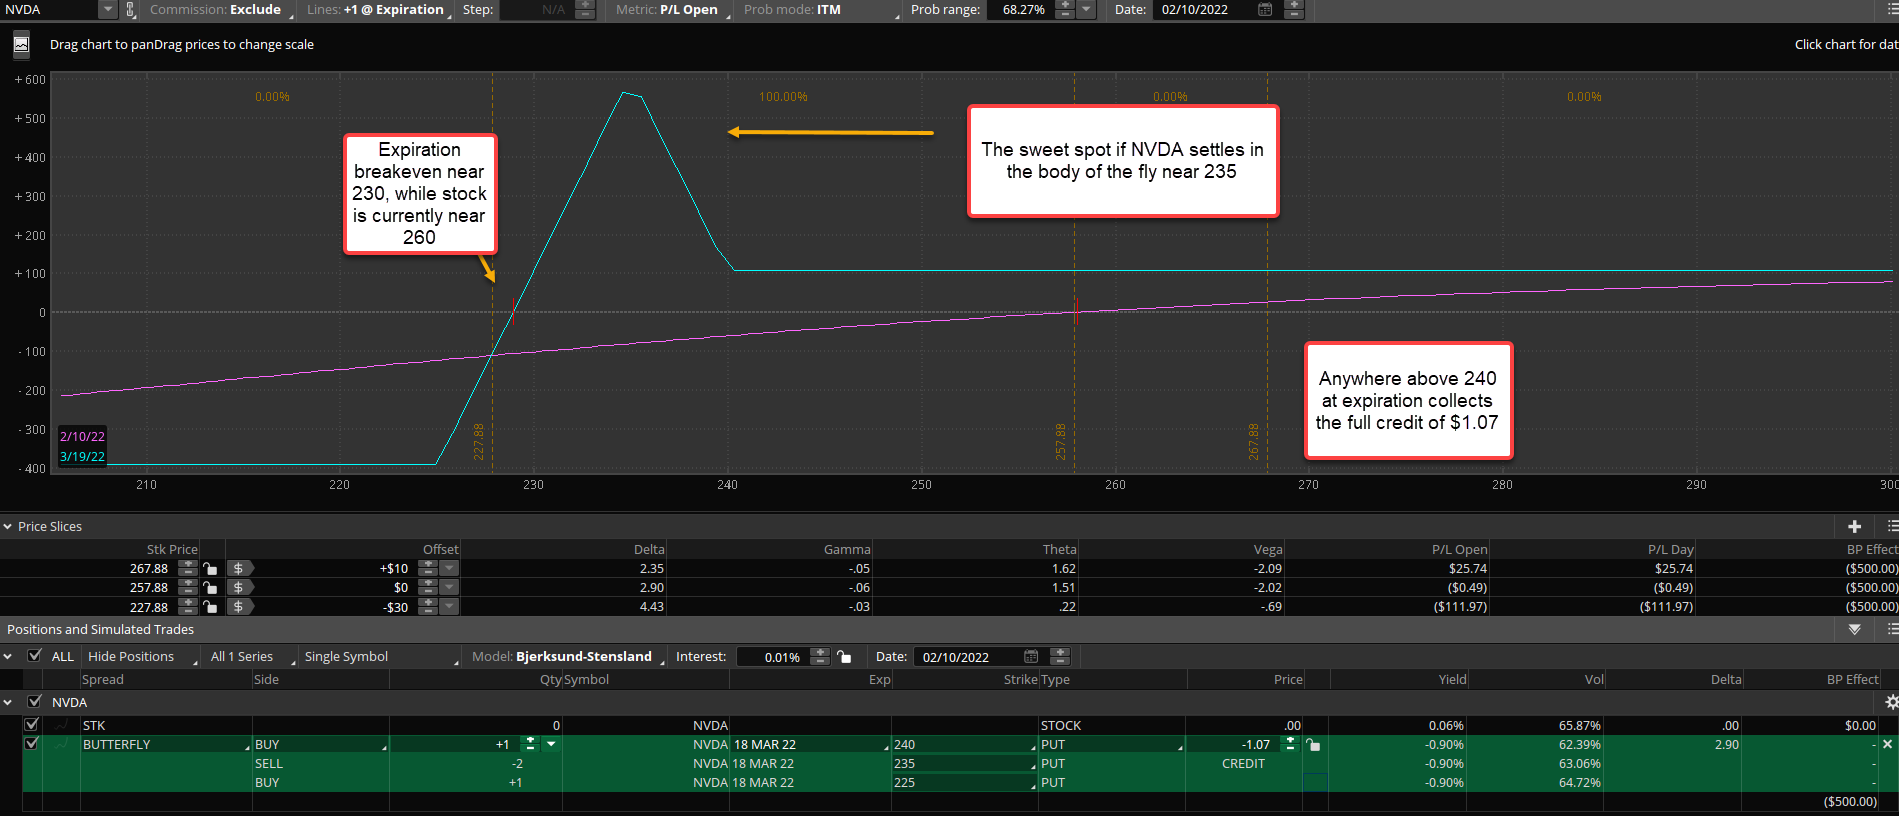
One way to put this trade on is further out of the money as in the NVDA example here. The stock has earnings coming in the next week so premiums on the options are more juiced which makes it possible to collect more of a credit on this type of fly. If you think NVDA stays above 230 with the stock currently at 260 but think it might slide a little lower you might put this trade on and have a wide range of profitability without much delta risk. Your main risk is if there is a sharp move lower under your breakeven of 230 but even then risk is defined to a max loss of $3.90 roughly. The point of this trade is to play a neutral to up move but still have a spot where you feel there is support and that is where you would place your center short strikes. If it does settle near expiration at that 235 level then the trade can max out nicely at a $5.00 debit and since you took in a $1.00 credit roughly you have a max gain of $6.00 per spread potentially.
Another method to play the skip strike butterfly with a little more risk/reward potential is to pay a small debit but still have a wide range to be in the sweet spot of the butterfly. The TSLA skip strike butterfly below shows a debit of $1.00 for the Feb 975/1000/1030 call fly. 25 points of width on the low end and 30 points of width on the top side of the fly. This creates a small upside risk scenario that you want to avoid. So ideally you do this if you anticipate a higher grinding move but not an explosion higher. This trade works very well if TSLA saw a slow rally up and stopped near that middle short strike so structuring the butterfly based around key price levels on the chart is important. Generally stocks do grind slower most of the time so a trade like this takes advantage of time passing (theta) and a small positive delta position. Using the right expiration cycle is important here too because going out too far in time might hinder the potential payoff. If going out over 30-40 days it’s not going to have much movement if the stock goes to your target. These are best done with expirations between 7 and 21 days from my experience. But that also means you are comfortable watching price daily and managing the risk behind a sharper unexpected move.

If you are going to trade a farther out expiration skip strike butterfly it’s going to have more time for the stock to move your way but also will not expand or contract as quickly. Often this is a nice tradeoff for most people that can’t watch the screens each day. Also this is generally how funds and institutions will use skip strike butterfly spreads. For example currently it is the month of February if you went out 3 months to May expiration you could construct a wide skip strike butterfly for a small debit. We actually saw a large trader put this kind of trade in FB stock on 2/10 and the risk graph is shown below. The May 270/300/320 call fly for a net debit of 1.80 was bought in size and I thought it was interesting to look at the structure. The trader is expecting FB to grind up into the 250-300 range essentially over time but not likely a fast way. You can see below that I changed the P&L date to 3/31 which is about 6 weeks forward in time. The risk graph expands nicely in favor of the spread as long as the stock gravitates up in the range between 235 and 320 roughly with the sweet spot being near 280-290. A cheap way to play a potential upside recovery in shares between now and May.

Unbalanced Butterfly
Directional Lean: Neutral to Slight Directional Lean
Best Market Environment: Somewhat calm but choppy
Ideal Setup: Into a Trend Move which stalls at resistance
Lastly the other variation of a butterfly you can use is the unbalanced fly where you construct your strikes in an ‘unbalanced’ way. You do this by using the 1x3x2 fly structure. Similar characteristics to the broken wing butterfly but more so on steroids essentially because you are short an extra option in the middle, 3 short options for every one long option. This produces some massive leverage of time decay potential but also caution is warranted and precision of timing price levels is important. The unbalanced fly variety is nice because if used closer to expiration (less than 2-3 weeks) you can get a nice positive theta decay (with higher gamma risk however) while you wait for the stock to potentially get close to the sweet spot during expiration week.
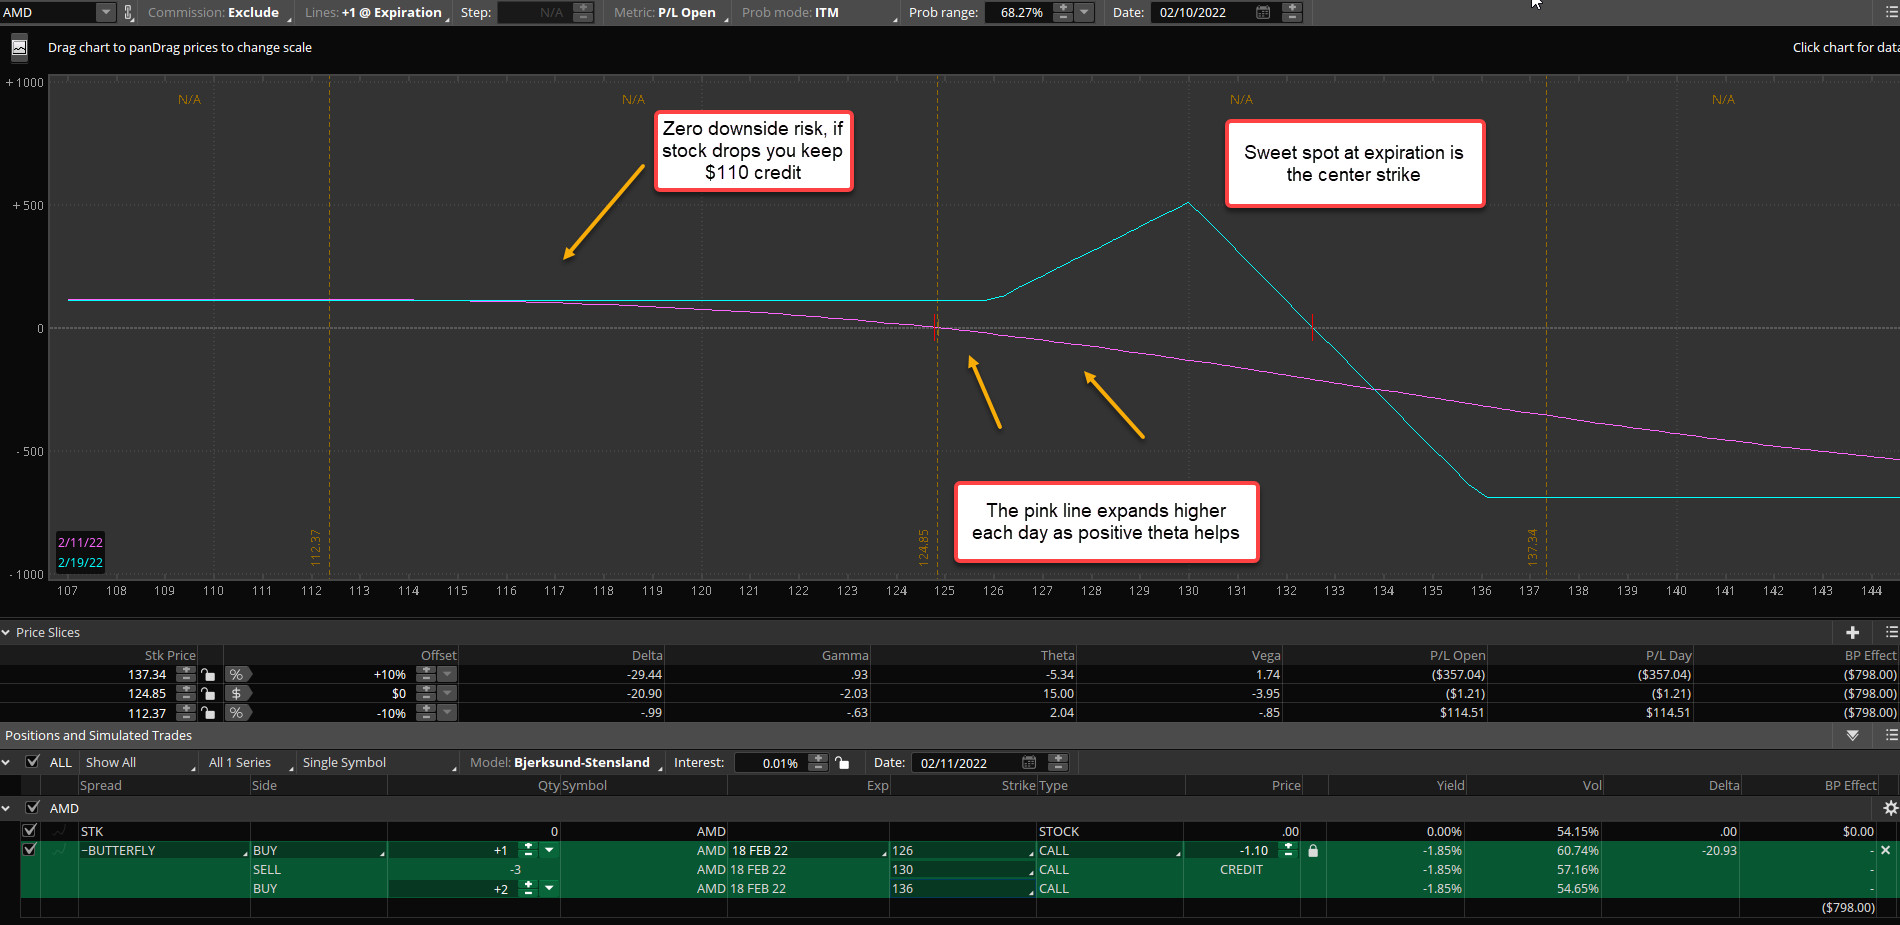
In the example below with AMD you can see this 126/130/136 fly that expires in 8 days can be traded for a $1.10 credit with the stock currently at 125. If you expect a slow methodical grind up towards 130 by expiration this is a nice structure but you need to make sure that 130 provides strong resistance because you do not want this stock to explode beyond your center strike. Thus it bears watching on a daily basis. Since you are selling an extra center strike you really benefit from the stock either doing nothing, going slightly higher and stalling out, or even if it crashes you still make money from the $110 credit you collected in this example. The main risk here with the 1x3x2 unbalanced fly is a large gap higher through your upper strike since you would have risk of loss above that strike, in this case 133 in AMD, however it is still a defined risk spread.
Takeaways:
- Butterfly option spreads can be very flexible based on the trader’s assumption of the current market environment of being up, down, or sideways and more importantly what velocity a move might show.
- A broken wing fly offers more directional exposure and potential payoff but can cost more. It’s great to use for catalysts like earnings reports when outliers happen more.
- A skip strike butterfly is best in higher implied volatility markets and benefits from neutral or slightly directional price action.
- The unbalanced fly is similar to the above but a little more theta decay potential from a sideways grinding move but also profits in a wide range.