An Explanation of the Current Destruction of Growth Stocks: What Happened, What to Do & When
Despite the S&P, Nasdaq and Dow Jones trading near all-time highs to start 2022 the real story has been the destruction under the surface in growth stocks. Investors that are of the buy and hold type are learning a tough lesson watching many of these stocks sink more than 50% in under two months and most have no idea why it is happening, how to avoid it and how to have a better strategy to avoid these massive drawdowns. The purpose of this post is to try and cover all of those dynamics as succinctly and clear as possible.
Why are growth stocks selling off?
- Valuation – I am not talking about the actual number and have said many times that valuation is a terrible reason to sell a stock going up but one has to understand that when the environment shifts and a stock starts coming down you have to look closer at historical metrics. I will discuss the factors that have created a new environment soon and also the technical/momentum angle. These high growth names saw meteoric rises in record time based on future expectations of revenues and eventual earnings but the current environment is shifting away from long duration stocks to short duration stocks, much of which was triggered by the Fed’s hawkish turn in early December. Long duration equities are those that are expected to deliver a higher proportion of future cashflows in the distant future which makes them more sensitive to interest rate movements. The concept is borrowed from Fixed Income markets but translate well to a group of stocks that were trading on expected revenues/earnings far into the future. Higher rates are considered neutral to positive for short-duration value stocks and negative for long-duration growth stocks. So, getting back to valuation you can look at a name like Cloudflare (NET) which reached 80X NTM EV/Sales and in the past six weeks shares have fallen 50% to reset the multiple to 40X, which is still extremely high and compounding this issue is many of these names have very limited profitability, NET for example is not expected to reach even $0.20/share until 2024. So, what we are seeing is a rapid multiple compression and the only thing that can offset a multiple compression is earnings growth, which many of these names are lacking and this exacerbates the sharpness of these declines. The market as a whole in 2021 saw around 7% multiple compression with 35%+ earnings growth, the latter picked up the weight as the multiple expansion environment shifted but with many of these growth stocks there is no earnings stream to be picking up that weight. The other thing with multiples is they tend to expand during accelerating growth phases and contract during decelerating phases and when you look at most of these Tech stocks they are coming off robust growth quarters and likely the best they will ever see which leads to deceleration, and, you guessed it, even more multiple compression.
- The Fed – As discussed above many of these names were already to see reality set in on the multiple compression is coming idea with tough comps a key driver but what really threw the gasoline on the fire was the Fed’s hawkish turn in Q4 2021 accelerating the taper and ramping up expectations for rate hikes through 2024. Much of this is an over-reaction as we are likely to remain in a historically low rate environment for a very long time but investors are more of the shoot now, ask questions later type.
- Adobe (ADBE) – On 12/16 Adobe, a Software juggernaut and one of the best-run Tech names on the planet, came out with in-line numbers while cutting Q1 and the FY22 outlook. This took me by surprise and my first reaction was the right one, Software stocks are going to be in for a real rough couple of months.
- Sentiment – Things got out of control with all the hype about all these names set to grow revenues and expressing their huge TAMs and everyone thought they were a genius for being able to sort a table by revenue growth and buy the names “growing quickly” completely abandoning any concept of scaling, unit economics, management, competition etc. It became a buy at any price crowd that got caught up in a boom cycle and now sits holding the bag refusing to respect what the market is saying and not understanding how quickly a cycle can shift.
The Mechanics of the Move
I am making some assumptions here, but I feel what happened is that Hedge Funds jammed these growth names up real high utilizing all the tools in the shed in a market that was seeing robust adoption of options and weaponized Gamma. A few weeks ago, I saw that there was a record amount of retail inflows into equities into 2021 and that was a major warning signal. Momentum works in both directions so these Hedge Funds are now dumping the positions to retail investors to which they generated just enough FOMO with the rapid upside returns and these stocks have zero real support from institutional buyers because there is not a true valuation floor to the majority of these stocks. Remember, valuation does not matter when things are good but when the cycle turns it is all that matters, and forward market returns over a long enough time period always come back to valuation.
How could I have avoided this crash in growth stocks?
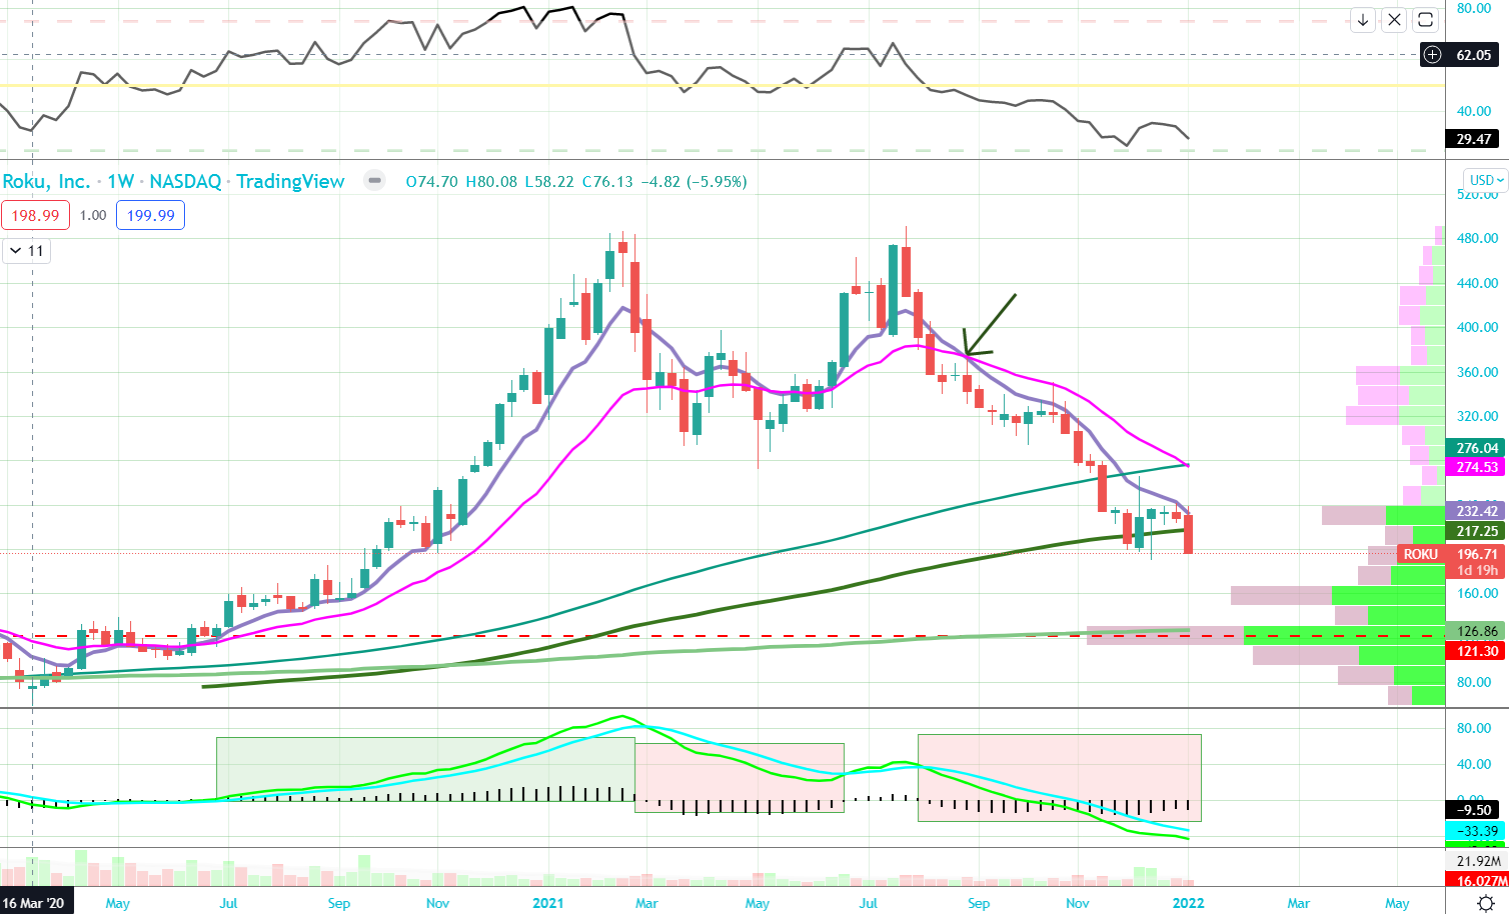
There were plenty of times on the way up where I beat myself up over my over-active approach and said to myself “I should just buy these names and lose my account password”, but now here I set unscathed thanks to my approach so I guess I should just stick to my signals. One signal I have harped on for the past decade on Twitter and to anyone else who would listen is moving average crossovers. The magic combination I prefer is 8/21 and the timeframe one should use needs to align with his/her intended/expected holding period. A long-term player should use weekly while a short-term momentum trader would be better off using daily. There is a give and take to this as the long-term weekly EMA cross user will capture more of the upside move with less trades but will also give back more before the exit signal fires while the short-term player will likely be in and out many times and miss good portions of the long-term upside move but will also have minimal drawdowns. There are alternatives to this method even using a single moving average but I find the crossover approach as having the best signals. I also recently wrote up about an approach using MACD histogram and only owning when in positive territory and being neutral/short when in negative territory which also worked very well across these names.
Roku (ROKU) as an example triggered the 8/21 week bull cross near $122 in June 2020 and shares rose to a high of $485 but the 8/21 remained in bull mode until a late August 2021 exit signal at $360. It has remained in bear mode and ROKU now sits at $196. Using the histogram approach you would have even done better highlighted with colored boxed below. Similar examples can be found across just about every one of these stocks, the indicators are consistent if you are disciplined enough to follow them!
What are some ways to utilize options with these signals?
Options are a great way to define your risk and one great way to secure gains in a growth/momentum stock is to utilize collars. The issue is to use them at the right time as you do not want to limit your upside and miss a big chunk of a move. One way to accomplish this would be using an overbought indicator, a simple one I like is weekly RSI above 80 but because stocks can stay overbought for long periods of time the actual execution signal fires when weekly RSI then moves back below 70. At this point you seek out a collar say 6 months out that provides you a level to get called away if the rise continues but also own a downside put to protect you from a sharp drawdown. There are plenty of other technical indicators to show how overbought a stock is, another one I like is dispersion from a weekly moving average which provides good historical context. The downside put offers you the ability to pre-determine a profit taking level if you captured a big run. Many people are too lazy to use options but you are absolutely foolish if you are not as they can be used in so many different ways to both enhance returns to minimize risks.
When will it be safe to buy these names again and what names do we buy?
This is a great question and one I wish I had a crystal ball to answer. I am starting to look back at former growth stocks that had major resets to determine if there is any key level, right now the 89 and 144 week EMAs are a candidate but have many more studies to run. You also have to keep in mind valuations and look at historical comps for where the market will reset the multiples. A cheating shortcut that I am waiting for as a signal is to start buying growth stocks again when we get bearish trend signals from all the stuff that is currently working like Banks, Energy, Materials, etc. because then TINA (There is No Alternative) sets in and in the end this is just a giant rotation of money flows. There are going to be plenty of “sucker rallies” along the way and when we see some hammer candles form and get “trade against” levels I have no problem taking a shot and seeing what may develop but keeping a tight leash. Ultimately, we want to see the bear signals that have triggered, 8/21 cross and MACD bear histogram, reverse for the patient investor as confirmation, and in this type of environment, patience pays.
As for what to buy, well you want to be buying the high quality names which requires both an assessment of the fundamental metrics as well as qualitative research like listening to management presentations and earnings calls. I certainly know what names are on my shopping list as I break down each and every industry and sub-group to identify the best-in-class names in our Annual Outlook which just went on sale.
https://optionshawk.com/products/2022-stock-market-outlook/
I see a lot of panic out there which is a good first step, at least for those of us who can stay calm and collected and realize that just about every great growth company of all time suffered plenty of 40% drawdowns. On the other hand there are also a ton of very low-quality companies that likely never recover from these sell-offs and completely flame out. I emphasize the importance of quality companies that have the ability to withstand a tougher environment and just keep on executing on their vision not concerned with the stock price in the current realizing the key to becoming a long-term winner is the same as it is for investors, look big picture, stay the course and understand that running a business and investing are both marathons, not sprints.
The wife is calling me to watch Dexter…I hope this helped frame the current environment and helps people moving forward to both avoid the mistake of HODL and realize these kind of moves are almost always telegraphed on multiple fronts.
Update 1/6/22
I decided that Salesforce (CRM) 2009-2020 was the most logical fit for a case study of growth corrections, a name that was hated on valuation the whole way up as one of the real first game-changing software companies. CRM also fits as a name that was rapidly growing and had many sharp corrections that it always recovered from with the caveat being it was always a top operator delivering stellar numbers with a fantastic CEO and a real strong vision for the future as it expanded into large markets with low penetration. The same can now be said about a lot of the growth stocks correcting which leads back to the key being identifying the right ones worth buying into corrections.
I wanted to finding a golden indicator which is always tough and wanted to avoid over-fitting. I use Fibonacci numbers for moving averages, there are a lot of historical studies showing them as more effective than the common ones people use, and in studying a dozen growth stocks from this era I kept coming to the 89-week EMA and if that did not hold the 144-week EMA tended to be a bottom, both Fibonacci numbers. If we think about it in an even simpler way that is basically a 1.5 year and 3 year period for a “regression to the mean” which also can fit the cyclical nature of businesses. I then wanted to also add a custom one, a two years of trading EMA which came to 101-week EMA when dividing by total trading days in five day weeks. The 101-week is pretty close to the 89-week when all said and done but worth looking at new angles.
Below shows the chart and I tried to keep it as clean and clear as possible, the 89/101 week EMA grouping was visited many times and held as support and the few occasions it failed with sharp sell-offs in 2012/2016/2020 the 144-week EMA was the golden ticket. By no means are these perfect and there was some slippage but if taking a long-term view on a name you have conviction as a growth leader with a bright future, buying these levels tends to work out very well over time.

Adobe (ADBE) similar:

Amazon (AMZN) shows a similar tendency:

Netflix (NFLX) once it got moving in 2012 has held the same levels:

I ran through just about every name that fits the Tech growth and the levels hold up and also tend to happen at similar time-frame intervals.
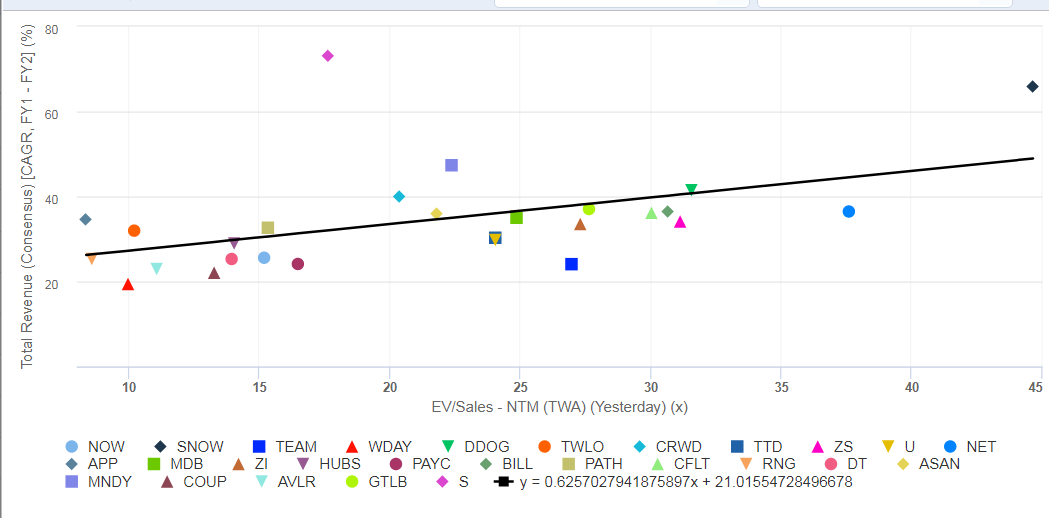
I put together the high growth basket for now and can see the average/median EV/Sales multiple is still 21X:
As I look across these names on the same long-term charts many are too new to have 89 and 144 week moving averages but just about every one that does is starting to come into the 89 week EMA with some around 10% above while others like ZS, DDOG, BILL remain well above. CRWD and CRM are reaching the level this week as is another quality name PAYC (shown below). NOW is a high quality name that has respected these EMAs previously with $528 the current 89-week and $511 the 101 week.

I can see a few of these names still trading above 25X are the ones yet to fully come in and would not be surprised by another 10-20% correction but, like those that came before, would still be in strong long-term uptrends with strong possibilities to make new highs 5, 10, 15 years from now.
There is even another method to explore, weekly Keltner channels (21-EMA) with a 3 ATR which shows some promising signals though is a bit ominous if applied to the hot growth names of today showing a ton of room left to fall, and who says the median/mean of 20X can not cause another 50% drop to 10X which is more in-line with historical norms and a level that can be accepted. Buy when others are fearful, there is some panic now but just possibly, we ain’t seen nothing yet!

