Calculating Expected Moves Using Options
Expected Moves Using Options
The implied or expected move is a great way to understand what the market is pricing in with a stock or overall market depending on implied volatility and time until expiration. It’s easily one of the more underrated ways of evaluating a stock’s potential whether it’s a short term view of one week or less, or looking out 1-3 months in time and projecting the odds that a stock stays above or below a certain price point. Expected move is the amount that a stock is projected to increase or decrease from its current stock price, based on the current implied volatility.
This is useful to know into binary events such as earnings reports but also in volatile markets where large ranges are commonplace. The expected move is what the market is pricing in as a movement in the stock either up or down. This is based on the normal probability model that sees a move being contained around 70% of the time, or the one standard deviation amount. Understanding what the 1 and 2 standard deviation moves in a stock are at any given time helps you create realistic expectations of what the market is pricing in as likely to occur. Implied volatility in options is the best way to gauge the expected range in a stock at any point in time because it’s an aggregate prediction of where all participants expect price to move, which as a result affects options premiums.
How to Manually Calculate the Expected Move
It’s pretty simple to use a software platform like Thinkorswim these days and get a quick idea of what the options market is predicting for an implied move by looking at the options chain statistics provided but if you don’t have that choice then you can do it manually with simple math. When looking to see what the expected move is for a binary event like earnings, you can look at the front month at the money (ATM) straddle and multiply its value by 0.85. Roughly 85% of the ATM front month straddle will give a good estimate of what the options market is pricing in as an implied move. A straddle is simply the at the money call and put option strikes. The implied volatility pricing of options ensures that the market is pricing in a certain amount of movement and if that move is not exceeded then the price of those options will likely fall because it was ‘fully priced’ in other words. This is also known as the IV vol crush of options.
Using the example below in AAPL stock I went back to the day prior to their earnings report event in late January. On 1/27, AAPL front week options had the at the money (ATM) $160 straddle pricing at $7.80. This was taken by adding the value of the 160 call and put. Then if we multiply that 7.80 value by 0.85 we get an expected move of roughly $6.63. That was the one day implied move for AAPL stock going up or down. It’s not a directional projection but rather the options market pricing risk in either direction so a price range can be ‘expected’. You’ll notice the little note at the top showing the “MMM market maker move” in Thinkorswim had shown 7.28 which is very close to our back of the envelope calculation of 6.63 using the at-the-money straddle. This doesn’t need to be precise, it’s simply a ballpark estimate to understand the range of movement the options are pricing in. So what did AAPL stock do the next day? It opened higher by 6.50 points before going higher further. Pretty accurate for an overnight estimate from the options market and implied volatility metrics.

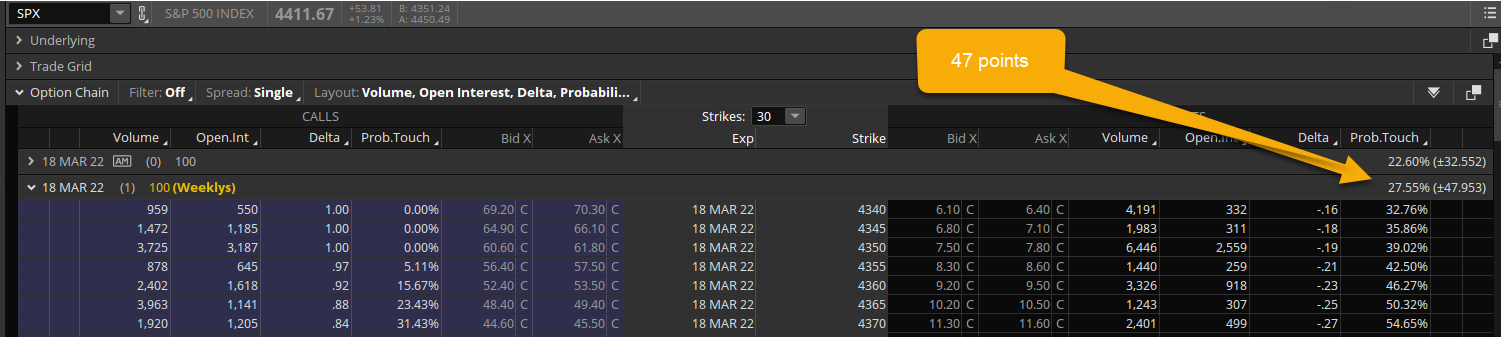
How to Find a Daily Expected Move
Similar to a binary event in a stock, sometimes it’s great to see what the overall market is pricing for the whole day or week. Looking at the options chain for an index like SPX is a great way to see that quickly. During the recent high volatility in current markets since the start of 2022 it has been very beneficial to me to be aware of the daily or weekly expected moves in SPX overall as a market gauge. The image below of the SPX options chain shows the March 18th options with 1 day of life left and they are pricing in about 47 points of movement for that one day. On an index priced at 4411 this is roughly a little more than 1.0% for a daily move. This is the kind of information a trader can use to plan trades or manage risk when you understand what the market expectation of price range is. It’s like having the weather forecast way in advance of the storm. It doesn’t mean you will see it play out exactly as the forecast prices in but being ready for that kind of weather is better than being in the dark not knowing what to expect.
This exercise can be repeated each week to calculate the expected move for the week. Infact its one of my favorite ways to prepare for the new trading week ahead, especially during volatile markets. At the end of each week you can look at the options chain to see the options expiring in 7 days from Friday and see what the options market is handicapping for the next week. Lately these weekly expected moves in the SPX have been 125-150 points per week given the elevated implied volatility (VIX) levels in the market. Marking these levels on the upper and lower bounds of the price chart is a nice way to see when the market has moved to the level that was “expected”. If you want to know the range expected for a stock in the next month then simply look at the options expiration closest to 30 days and look at the calculation. Same can be done for the expected move 1 year from now. It’s all just an estimate based on current implied volatility but it’s the most accurate depiction of risk available and the market has a good way of pricing these moves.
When to Use Expected Moves
Often these expected move levels have a tendency to be tested more frequently than people think. If the options market is pricing in a move up or down 5% then it’s likely to get there and sometimes even move beyond it. These levels can be good profit target levels or at least spots where you would expect price to resist on the first attempt to get through. Naturally, dealers and market makers are very aware of the levels since they are what they “priced in” ahead of time. So if prices breach these important levels it forces dealers to sometimes defend their positions and that’s where a greater than expected move can transpire.
The primary benefit of knowing what the expected move is can be to use it as a risk management aid. Knowing what the expectation of price movements are can help traders decide on the amount of risk they are taking compared to the market’s assumptions. If you bought a stock or option anticipating a large advance higher you can use the expected move as a level to exit your trade with a profit or at least trail up your stop loss and sell half. Understanding the further away from the expected move a stock move’s the more likely mean reversion can change the trend. Simply using the probability and stats from the dynamic options market will help you form realistic goals in your trading.
Takeaways:
- Expected move gives traders the chance to calculate an expected range of price movement for a stock in a certain timeframe.
- Taking the at the money front month straddle and multiplying by 0.85 is a simple way to calculate expected moves for binary events such as earnings reports.
- Using the expected move can help aid in managing risk and hedging a portfolio by knowing what the market is pricing in.
- Knowing the expected move for a day, week or month can be a way to target price levels to exit profitable trades since they can often mean revert from these levels.