How to Use the VIX as a Market Signal
The Volatility index or VIX as I will refer to it has been a hot topic to start 2022 as market volatility has ramped up and surged back to levels not seen in the last year. When volatility increases it becomes that much more important to watch the VIX and how it correlates to stock prices inversely. The VIX is a statistic that measures the implied volatility of S&P 500 (SPX) options. If you trade options then you should know this already but it’s good to review. In general when traders are worried or concerned then options prices rise as the cost of insurance becomes more valuable. This is easily measured by the VIX since implied volatility tends to show risk to the downside in stock indexes. Meaning that the velocity of larger moves happens to the downside, it’s more rare for fast velocity to the upside since market rallies tend to be calm and orderly. You cannot trade the VIX itself but you can trade VIX futures (symbol /VX) or other ETN’s like VXX that track it closely but have an embedded drag or contango component that make it only a short term trading instrument if at all.
Overall, the VIX is a fantastic leading indicator to track in a volatile market as we are in now. You can define volatile simply as anytime the VIX is over 20. As above that level is where 1%+ daily ranges are the norm and the closer to 30 VIX you get the more unstable markets become. Whether you are a day trader or longer term investor you can use this tool to help your market timing prowess. Without getting too deep into VIX dynamics and volatility markets there are a few key signals to watch for near market turning points. These signals include VIX term structure, VVIX or volatility of VIX itself, VIX distance from 20 day MA, and also the spread between VIX/VXV.
VIX Term Structure
The VIX futures have contract months in the future like any other futures contract and generally will be in a state of contango which simply means that VIX futures further out in time will be higher than the front month. Since risk 3-6 months away should be more unknown it makes sense that VIX futures are higher the longer in duration you look. When the front month VIX future becomes the highest contract price that is known as backwardation and shows elevated fear in the near term. Most of the time the VIX futures will be in contango as the term structure slopes higher as the below example shows from December 31, 2021. Generally a VIX in contango can be indicative of a calm stable trending stock market.
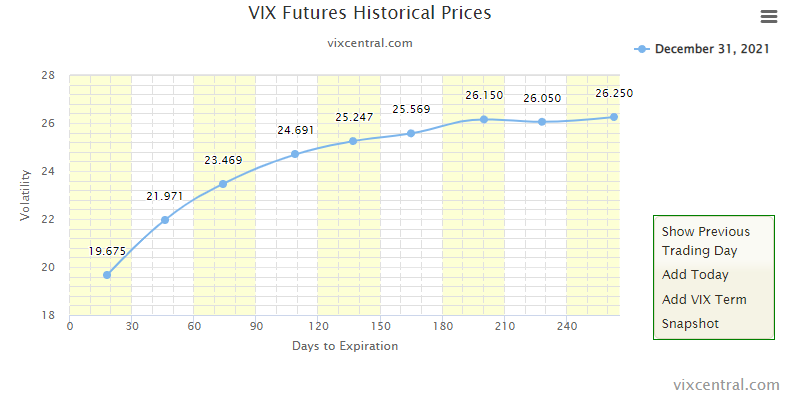
But in times of panic and fear such as last week in the markets, you will see VIX go into backwardation as shown below in the chart from January 27th (blue line). With the front month Feb contract at the highest levels near 29 it showed extreme fear which is often unsustainable. The following day January 28th is shown by the black line which clearly has compressed down and nearly lost the backwardation from a day earlier. This is the kind of signal that can be very powerful to nail a market bottom in the short to medium term. Even more valuable when SPX declines into a large support zone on longer term timeframes. As backwardation shows a real panic with dealers hedging portfolios at any price available it can mark a significant level to trade against or even longer term bottoms towards the end of corrections. Imagine someone buying insurance to protect themselves in the next 30 days at prices higher than a year from now. That’s what backwardation is. The storm hit and panic showed up. Which is very rarely sustainable. It doesn’t mean however that it will be a perfect bottom right when VIX gets backwardated. Sometimes you will have to wait a few days or longer for the market to stabilize and shake out weak longs. But if swing trading or investing it’s often a great inflection point.

VVIX (Volatility of the VIX itself)
Another key metric to keep an eye on is the level of the VVIX. The VVIX just measures the implied volatility of the VIX options. The second derivative of the VIX basically. This almost always is above 100 with its normal range since the pandemic closer to 110-115. It mostly catches my eye if it starts to get above 120, especially if the SPX or most other stock indexes are not showing concern. VVIX is usually the first to move. It can signal a move higher coming in VIX before stocks slide lower. Or towards the end of a selloff it can signal a low coming if it diverges from VIX itself.
In times of extreme volatility this can spike quickly above 150 which is often a signal that the volatility markets are overreacting. During the January 2022 recent correction in markets the VVIX hit a high of 172 on 1/24. The rest of the week saw lower lows each day for the VVIX even while the SPY chopped violently between 430-440 making many traders second guess the upside rebound potential. You can see at point 1 it started to flash some warning signs in early January as stocks started to fade. The VVIX had a few surges up above 120 without much ability to stay below 110. Then once the SPY selloff accelerated into late January the VVIX closed multiple days above its upper bollinger band and hit an extreme high which usually comes back to its mean. At point 2, while the SPY stabilized and formed a range after the panic low on 1/24 you can see VVIX was already getting clobbered much lower beneath its 1/24 highs. The inability of VVIX to sustain higher was a great clue that the worst was likely over in the short term. If VIX was going to sustain its higher levels over 30 then VVIX likely should have stayed above 150. It could not and then the reflex rally began in stocks.

VIX distance from 20 day MA
I like to track the distance between the VIX and the 20 day MA. You can use the 21 day or the 10 day. It really doesn’t matter but I just use the default moving average on the bollinger bands which goes well with the VIX to see when it’s extended. Often when the VIX closes two days above the upper bollinger band it signals a short term peak in volatility and bottom in SPX. The VIX is a mean reverting asset which just means it cannot stay extended for long. The rubber band effect is strong and when it gets too far from its 20 day moving average it’s highly likely to revert back lower towards that 20 day MA. This is why technical analysis on the VIX is useless and traders who try to do that don’t really understand what the VIX is. It’s much more effective to use a metric like this to see how extended away from a key moving average this volatility statistic is. In the screenshot below you can see all the times I pointed out where the VIX closed above its upper bollinger band, and this often coincided with VIX being at least 30% above its 20 day MA. Using the “Disparity index” study in Thinkorswim is an easy way to see how far away from a moving average something is. I have it set to the 20 day MA in this case and we can see that the 30 level on the disparity index often was a level where the VIX “rubber band” got too stretched and then reverted back to its “mean” at the 20 day MA (blue line).

This example shows 9 different occurrences since mid 2020 that the VIX signaled a short term low in SPX and stocks rebounded for multiple weeks or even months. Obviously during the COVID crash this got much higher and was an outlier event but that was also a time where VIX went backwardated and stayed in that status for several weeks. The idea behind the distance between VIX and the 20 day MA is to know “how much is too much” when it comes to volatility overreacting. Just from the past two years of occurrences its safe to say when the VIX gets 30% above its 20 day MA it has shown a strong likelihood of an inflection point in the markets and can be yet another tool in the box you use as a trader to identify moments in time to take more risk and look for stocks to rebound.
VIX/VXV spread
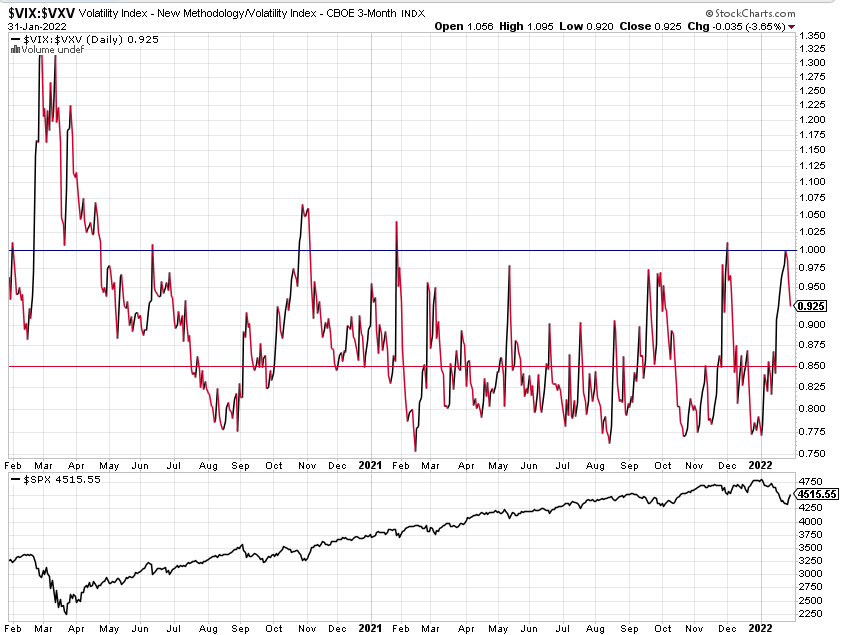
One other thing to watch in relation to the VIX is the spread between the front month VIX spot price and the 3 month VXV price. This rarely gets over 1.00 and when it does it’s often a very good signal the stock market is about to turn higher. Very similar idea to the first signal I discussed above with VIX term structure going from contango to backwardation. This simply compares the VIX price level of 1 month options versus 3 month options. The whole term structure of VIX futures doesn’t have to be inverted fully but if the 1 month VIX is close to the same value as 3 month VXV this would then make this spread equal 1.00. This occurred most recently last week as SPX saw a panic low into 4225. In a normal market this should not sustain many days above the 1.00 level. When it did that in late Feb and early March 2020 the VIX was telling us that something very unusual was unfolding and that was indeed not normal as the COVID crash ensued. During that month the VIX/VXV ratio stayed over 1.00 for over a month.
Other Factors to Watch
As options volume becomes more of a factor in markets it pays to watch for call volume spikes in VIX options. Specifically something as simple as seeing 1 million calls trade in the VIX call options in one day. Joe @Optionshawk himself mentioned this ahead of the 1/24 low in SPX and with over 900k calls trading in VIX that day it proved to be a useful signal that panic was in place. Similar concept to tracking put/call ratios in all options but when people are buying VIX calls it usually is for one reason. To protect downside risk, and when you get a surge like close to 1 million contracts in a day it screams panic.
Also now and then the other indexes like Nasdaq and Russell will diverge from the S&P and have different levels of volatility that may spillover to the whole market eventually. Watching VXN (Nasdaq VIX) and the RVX (Russell VIX) can be an added tool when volatility starts to emerge in the more growth heavy Nasdaq and Russell indexes. There is never just one signal that points to a clear green or red light in the markets so it’s important to be constantly evaluating multiple factors and adapting to changing markets because the only certainty is that they will change. Stay ahead of the next move by tracking what the volatility markets are saying because they are almost always correct.