Intro to Implied Volatility and How to Use It
Implied Volatility or “IV” as I will refer to it for most of this post, is the way the options market prices in the potential movement of a stock price during a specific timeframe. It’s not a perfect calculation that forecasts the future volatility of a stock but it gives a good implied market assumption of what is likely to happen going forward. These implied moves or ranges are determined by the market forces of supply and demand. When traders are buying options, especially aggressively at the offer price, then that drives up prices for options as implied volatility increases. Likewise, when traders are selling options, especially if they hit the bid aggressively, then that pushes option prices down as implied volatility decreases. Similar to a stock price being determined by bids and offers and who is more aggressive, options prices change based on where implied volatility is going. As market participants begin to expect a larger potential move up or down in a stock, that will be reflected in the implied volatility of the underlying stock moving up and the premium for options will be more inflated to justify the market’s view of the future.
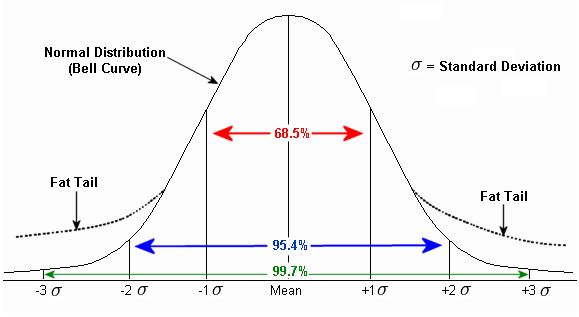
IV is shown as a percentage number when viewed on an option chain and is displayed on an annual basis with a one standard deviation probability of accuracy. That means just like a typical normal distribution bell curve shown below, the options market will price in an implied move in the stock for 68.2% of the time. If a stock is pricing in a 5% move on their earnings report, it’s the option market saying that roughly two thirds of the time (68.2%) the stock should move in an expected range, plus or minus of 5%. The two standard deviation zones are where 95.4% of all occurrences should lie and the option prices beyond the 2 or 3 standard deviation levels (think less than 5 delta options) is where the market prices in fat tail risk. This is also known as outlier risk.
IV is often known as a gauge of fear, because when IV increases that usually points to uncertainty in the market. This tends to mean investors are buying options to speculate or hedge their positions. When you see a stock with high IV relative to where it’s been, that tends to mean options prices are higher than normal and the market is pricing in greater than normal stock price movement. On the flip side, if we see IV on the low end of what is typical, that generally means you should expect less stock price movement. Even though stocks can have wild movements when IV is high, some of the bigger unexpected moves tend to start when IV is on the low end of the spectrum as the market can be caught off guard if a stock makes a greater than expected move. When IV is inflated and higher it doesn’t always mean it will continue to expand but oftentimes implied volatility is overpriced compared to the stocks realized volatility so IV will then revert to the mean.
Expected Moves Based on IV Changes
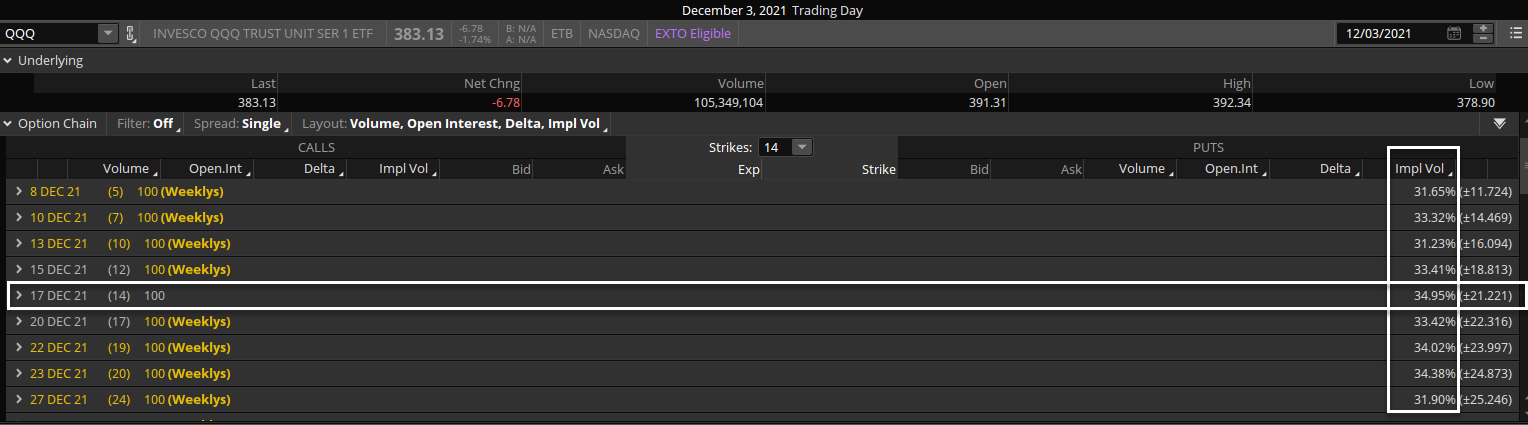
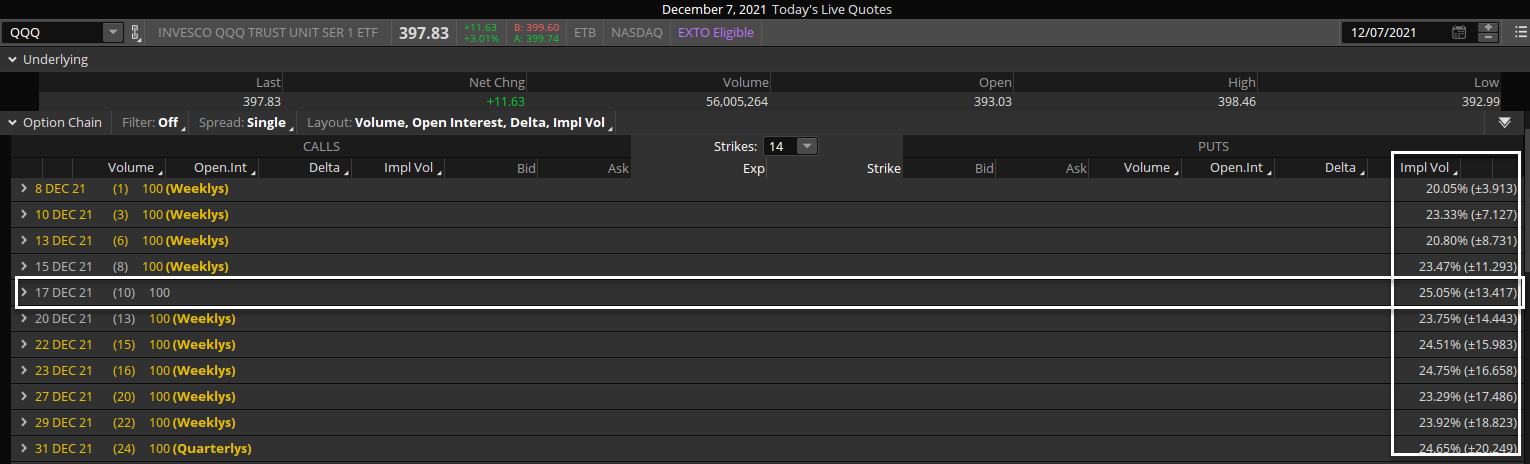
The option chains below show two separate days for the QQQ options. The first being a screenshot from December 3, 2021 when a selloff in the markets pushed stocks lower and IV ramped higher. QQQ options were showing IV closer to 35% in the December monthly options with two weeks until expiration. This was pricing in an expected move of roughly 21 points before expiration. Then just 4 days later after fear subsides and the market rallies in a strong fashion, the QQQ option chain sees a sharp drop in implied volatility and the same December monthly options dropped about 10 full IV points to now showing just 25% IV. This translates to an expected move before expiration of +/- 13.40 points. A large change in market sentiment and fear changed the IV so drastically that now the market is pricing in a move of nearly half as much movement. That’s the powerful dynamic of changing implied volatility in the markets.
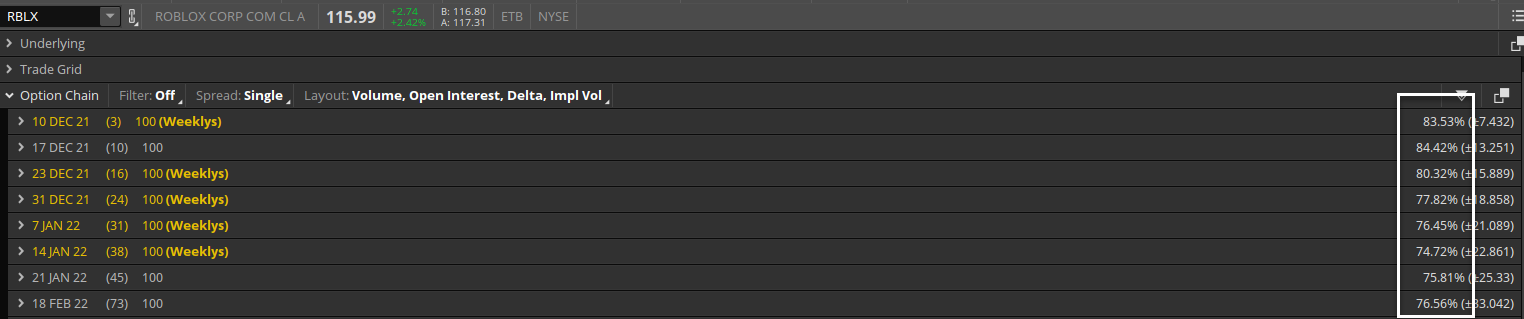
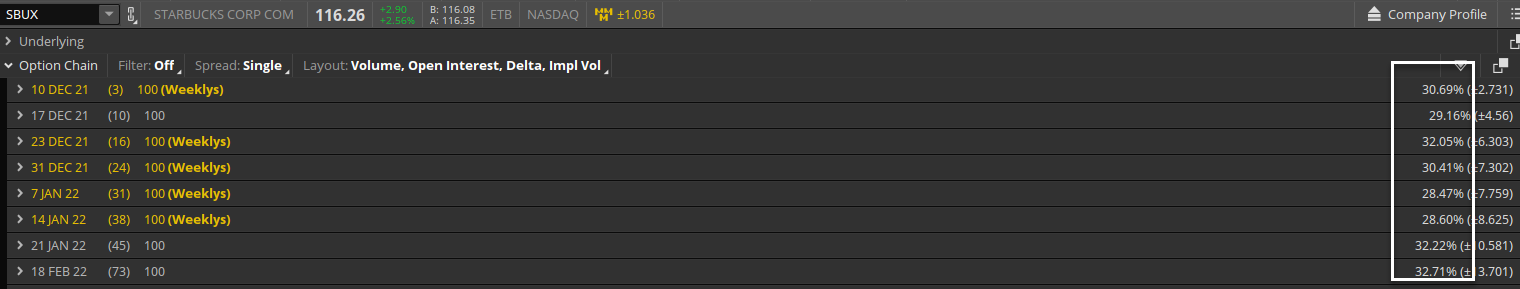
IV helps traders put context around what the market expects from a stock within a specific time horizon. IV can be different for each month of expiration in the future, it just depends what the market is perceiving as risk going forward. In general a higher priced option will have higher IV. Options prices drive what the IV is in a stock. You can compare two different stocks in different industries but with similar stock prices and the difference between their options prices is going to be based on the difference in their IV. For example the comparison below of the options chains between Starbucks (SBUX) and Roblox (RBLX). They are both stocks currently at nearly the same stock price of about 116 but these stocks move in wildly different ways. SBUX is a lower volatility consumer discretionary stock while RBLX is a newer up and coming tech IPO with higher volatility. The option IV for SBUX is close to 30% while the IV for RBLX is a much higher 80% on average. Two stocks with the same stock price but the options market pricing in more than twice the expected move in the future for RBLX compared to SBUX. That’s the fascinating part about implied volatility and how it can be used by a trader to understand expected moves in the market.
How IV Prices in Expected Future Ranges
If a stock is trading at $100/share and the implied volatility in its options is at 50% that means the options market is pricing in a one standard deviation range for the next year between $50-150. IV is basically saying there is a 68.2% probability that the stock lands somewhere between 50 and 150 in the next year, which represents 50% above and below the current price of 100. Of course since this is accounting for about two thirds of occurrences (68%) that means there is roughly a 32% chance the stock moves BEYOND its expected range one year from now. This is why implied volatility is just an estimate and not perfect. It’s based on what the market knows right now and what traders perceive to be true.
Real Time Example with TSLA
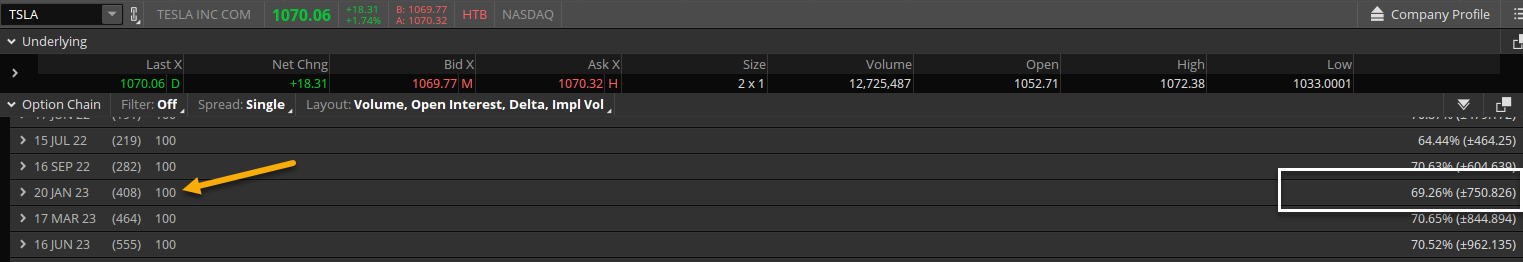
TSLA stock is trading at $1070 on 12/8/21 and its implied volatility is at about 70%, surely a volatile stock that is actively traded. This 70% IV translates to the options market pricing in a move of roughly 70% up or down in the next year. If we look at the January 2023 options chain which is closest to the one year timeframe we see the IV is pricing in a plus or minus expected range of about 750 points! With the stock currently at 1070 that is implying a potential range of 70% up or down. Quite the move being priced in which might mean it’s priced for perfection and would really have to surprise market expectations in order to exceed that large range. A 750 point advance would take the stock to over 1800/share by January 2023. Something that TSLA is fully capable of achieving based on past history but if you are buying options with IV this elevated you are at a disadvantage because the stock has to keep up its velocity in one direction in order for IV to stay this high. Implied volatility is simply a good way for traders to understand what the market is expecting during a certain timeframe and then from that information a trader can make a more rational assumption about the stock they are looking to trade. It helps traders put together reasonable price target objectives and overall is fairly accurate and efficient. Even if you don’t trade options, being aware of the expected moves and IV pricing can be a huge benefit to your trading and outlook.
The higher the IV environment for a stock or the market in general then the more uncertainty surrounds that market around its future potential stock movement. As we saw above in the QQQ option chain example, implied volatility is dynamic and changes constantly based on new market generated information. A 50% IV can quickly contract to 30% if stock price movement begins to slow or an earnings report has passed which takes away any unknowns in the short term.
Trading Implied Volatility
There are a myriad of methods to trade options based on IV movements but a few involve using spreads such as butterflies or calendars. In general when IV is lower it makes sense to construct a calendar spread as that is long vega and can rise in value if IV rises. This is also helpful to use when one month IV is much different versus a different month when there is an expected event such as earnings nearing and a trader can take advantage of the differences in IV between months by selling one month with higher IV and buying the other month option which has lower IV.
Butterflies are a short vega alternative and can be used as a neutral or directional trade strategy when IV is higher and you expect it to contract back lower. Since you are selling two middle strike options in a butterfly you are taking advantage of the higher relative IV and becoming net short volatility. A few other methods to getting short IV in a neutral way is selling iron condors or strangles which benefit from decreases in IV and neutral stock price movements. In general the higher the IV, the more benefit a trader has to collect more premium from a short option strategy. Because a higher IV environment requires stock prices to continue moving in large ways it becomes that much harder for high IV to continue simply based on the already exacerbated expectations around future prices. History shows that when we see a big spike in IV, we tend to see a contraction at some point in the future because similar to an insurance company charging high premiums as the storm approaches, those premiums tend to drop when the weather clears and the sun comes out.
Takeaways:
- Prices of options tend to drive Implied Volatility
- IV is a general good gauge of expected movement in a stock based on the options market pricing in the future.
- IV is shown in an option chain as an annual percentage move based on a one standard deviation assumption.
- Higher IV relative to past stock price movement indicates more expensive options
- Lower IV relative to past stock price movement indicators more cheap options.
- Implied volatility is not perfect but can guide a trader to form rational assumptions about how much a stock might move, up or down in a specific timeframe.