Intro to Using Fibonacci Trading Tools
What is the Fibonacci Sequence?
Fibonacci numbers are popular in the world of trading for various reasons but mostly because they show sequential patterns similar to that of price patterns in markets. There are plenty of ways to utilize the ratios and numbers in the Fibonacci sequence from retracements, projections, or extensions and even more. I will focus on the basics of what it is here and then move into how to apply it in trading analysis.
Leonardo Pisano Bogollo (1170-1250), an Italian mathematician from Pisa, is credited with introducing the Fibonacci sequence to the West. It is as follows:
0, 1, 1, 2, 3, 5, 8, 13, 21, 34, 55, 89, 144, 233, 377, 610, 987……
The sequence extends to infinity and contains many unique mathematical properties.
After 0 and 1, each number is the sum of the two prior numbers (1+2=3, 2+3=5, 5+8=13 8+13=21 etc.)
A number divided by the previous number approximates 1.618 (21/13=1.6153, 34/21=1.6190, 55/34=1.6176, 89/55=1.6181). The approximation nears 1.6180 as the numbers increase.
A number divided by the next highest number approximates .6180 (13/21=.6190, 21/34=.6176, 34/55=.6181, 55/89=.6179 etc….). The approximation nears .6180 as the numbers increase. This is the basis for the 61.8% retracement.
A number divided by another two places higher approximates .3820 (13/34=.382, 21/55=.3818, 34/89=.3820, 55/=144=3819 etc….). The approximation nears .3820 as the numbers increase. This is the basis for the 38.2% retracement. Also, note that 1 – .618 = .382
A number divided by another three places higher approximates .2360 (13/55=.2363, 21/89=.2359, 34/144=.2361, 55/233=.2361 etc….). The approximation nears .2360 as the numbers increase. This is the basis for the 23.6% retracement.
1.618 refers to the Golden Ratio or Golden Mean, also called Phi to the Greeks. The inverse of 1.618 is .618. These ratios can be found throughout nature, architecture, art, and biology.
OK, so you’re probably saying, that’s pretty cool, but how do you make money using this? Just like with anything in trading, nothing is certain and every tool is just another piece of the puzzle that can add conviction to a thesis. It’s important to remember that anything can happen and fib numbers are just levels of interest where something could happen but doesn’t have to. Infact, if a key fib retracement level like the 61.8% fails to attract buyers, that can be a clue that the stock is about to the opposite in a rapid way.
How do Fibonacci Numbers Apply to Trading?
When trading you likely have noticed that prices move in repeatable patterns and these price moves often see retracements after a long advance or decline. Each of the above ratios are common alert zones or levels of support or resistance in a trend of a stock. I would say the two ratios I like to use the most when measuring a retracement are the 38.2%, 61.8% and 50% levels. The 50% fib zone is not technically a “fib number” but since it’s halfway back of a move, it’s often used as a common pivot level for support or resistance by way of Dow Theory. For example if a stock advances from 80 to 100 then a 50% retracement of this 20 point move would be at 90, and that’s a level traders might anticipate buyers to emerge at as the trend resumes. The 61.8% fib level represents the last real sign of trend persisting during a pullback and if the market or stock is strong then it should not exceed the 61.8% retracement level of support.
Measuring a retracement can be useful to understand the depth of a move. If a stock only pulls back to its 23.6% fib retracement level that can be viewed as shallow and likely forming a bull flag within a stronger trend up. More common retracements are generally between that 38.2% and 50% range.
Retracement Ratios and Levels
Retracement levels alert traders or investors of a potential trend reversal, resistance area or support area. Retracements are based on the prior move. A bounce is expected to retrace a portion of the prior decline, while a correction is expected to retrace a portion of the prior advance. Once a pullback starts, traders can identify specific Fibonacci retracement levels for monitoring. As the correction approaches these retracements, traders should become more alert for a potential bullish reversal.
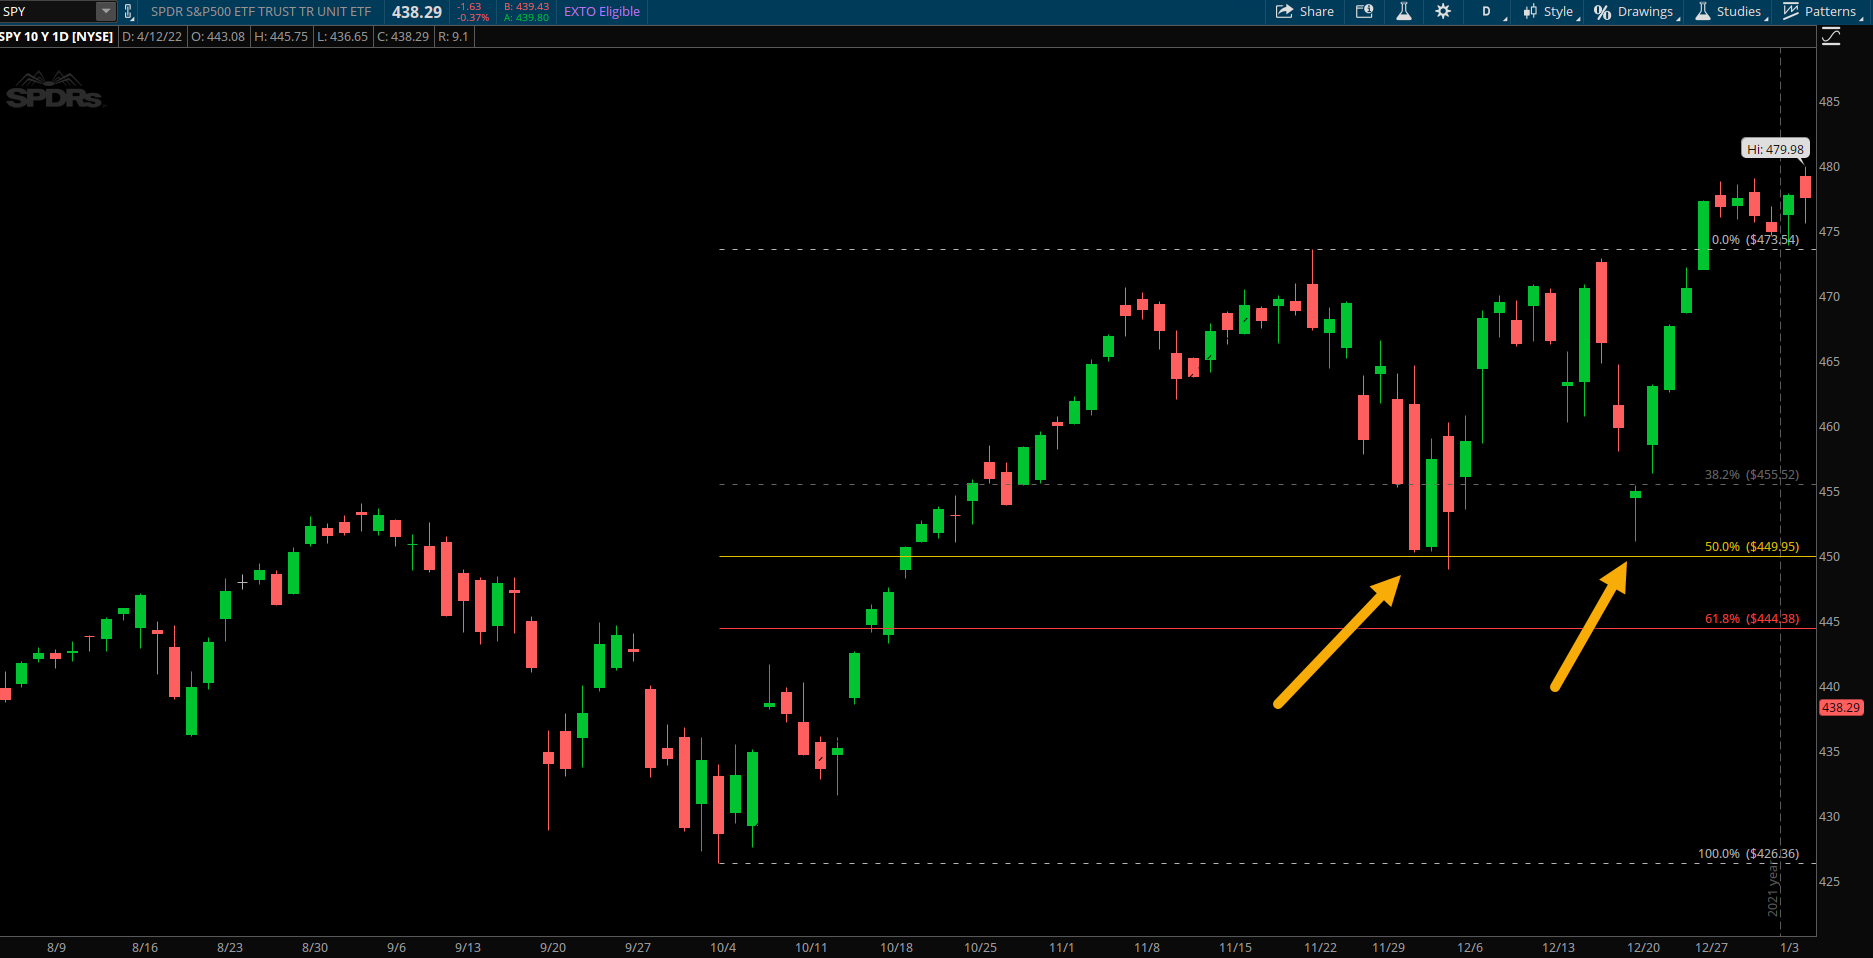
The example below shows a classic 50% retracement level providing support in an uptrending SPY chart from late 2021. You can see the market made new highs in October and the pullback found buyers at the 50% level near 450. Not once but twice. Generally the first test of these levels is more meaningful and is considered a stronger trend if not retested multiple times. Understanding where to look for potential reversals like this can be a great way to add Fibonacci levels to your trading arsenal.
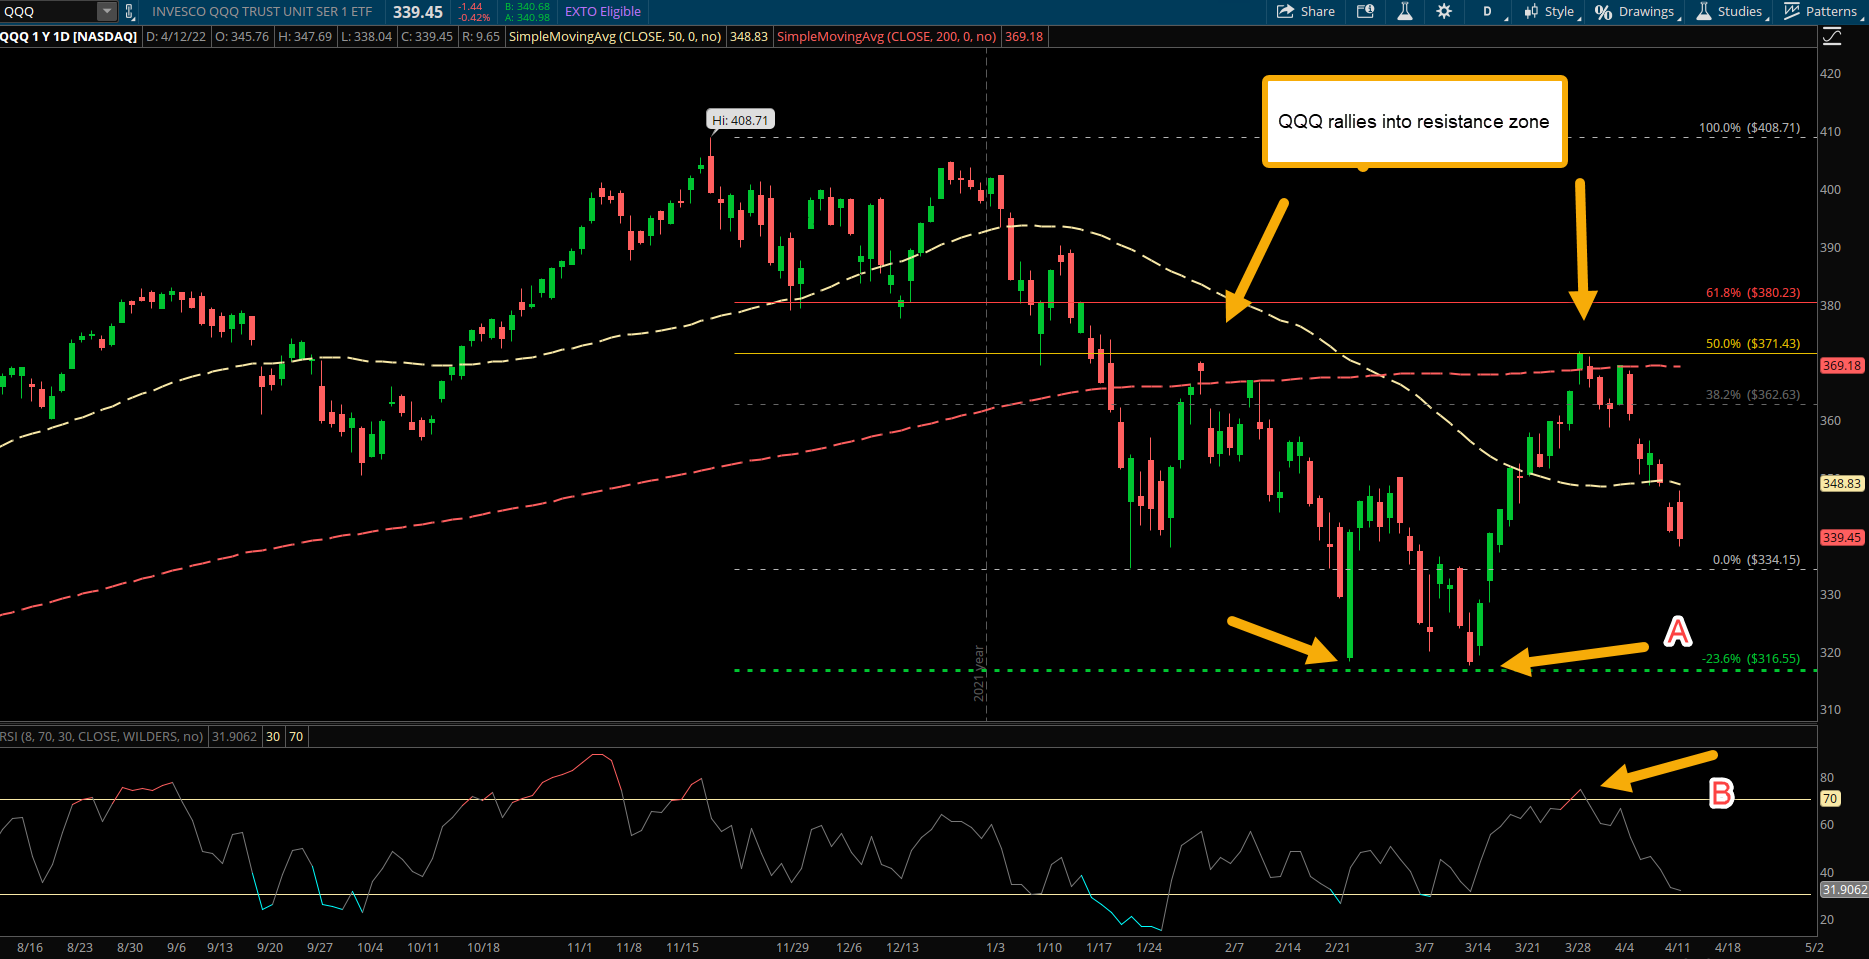
Using key fib levels can be even more powerful when combined with other tools and factors providing multiple reasons for strength behind a price zone. A confluence or cluster of moving averages, VWAP’s, or even volume profile derived support/resistance can be a great way to add confidence to a fibonacci level you have drawn. The QQQ daily chart below from the most recent 3 months of trading in 2022 shows an example of this. A fib retracement is drawn from the highs of 408 to the January lows at 334. The QQQ then proceeds to rally into near the 50% retracement level at 371. This is also near the area of the 200 day simple moving average, and below the declining 50 day MA. Certainly an area of potential resistance where the market could fail if sellers pounce. This selloff occurs in the coming days as QQQ slips back to the lows and actually makes new lows, nearly tagging perfectly the -23.6% fib level at 316 shown at point A. This negative -23.6% fib level is a useful one I like to use when projecting a possible target level AFTER the stock rejects from its 50% retracement and resumes its trend.
Later in March the market rallied sharply off lows and hit the former 50% retracement again for a second test which also marked the zone near the 200 day MA and price rolls back down. At point B, this second retest of the 371 area also showed the RSI indicator (setting at 8, fib number of course) as overbought which provided more evidence that price was exhausted and potentially could drop from there. The exact price points matter less but understanding that the zones of interest are what matter can be extremely timely when making trading or investing decisions.
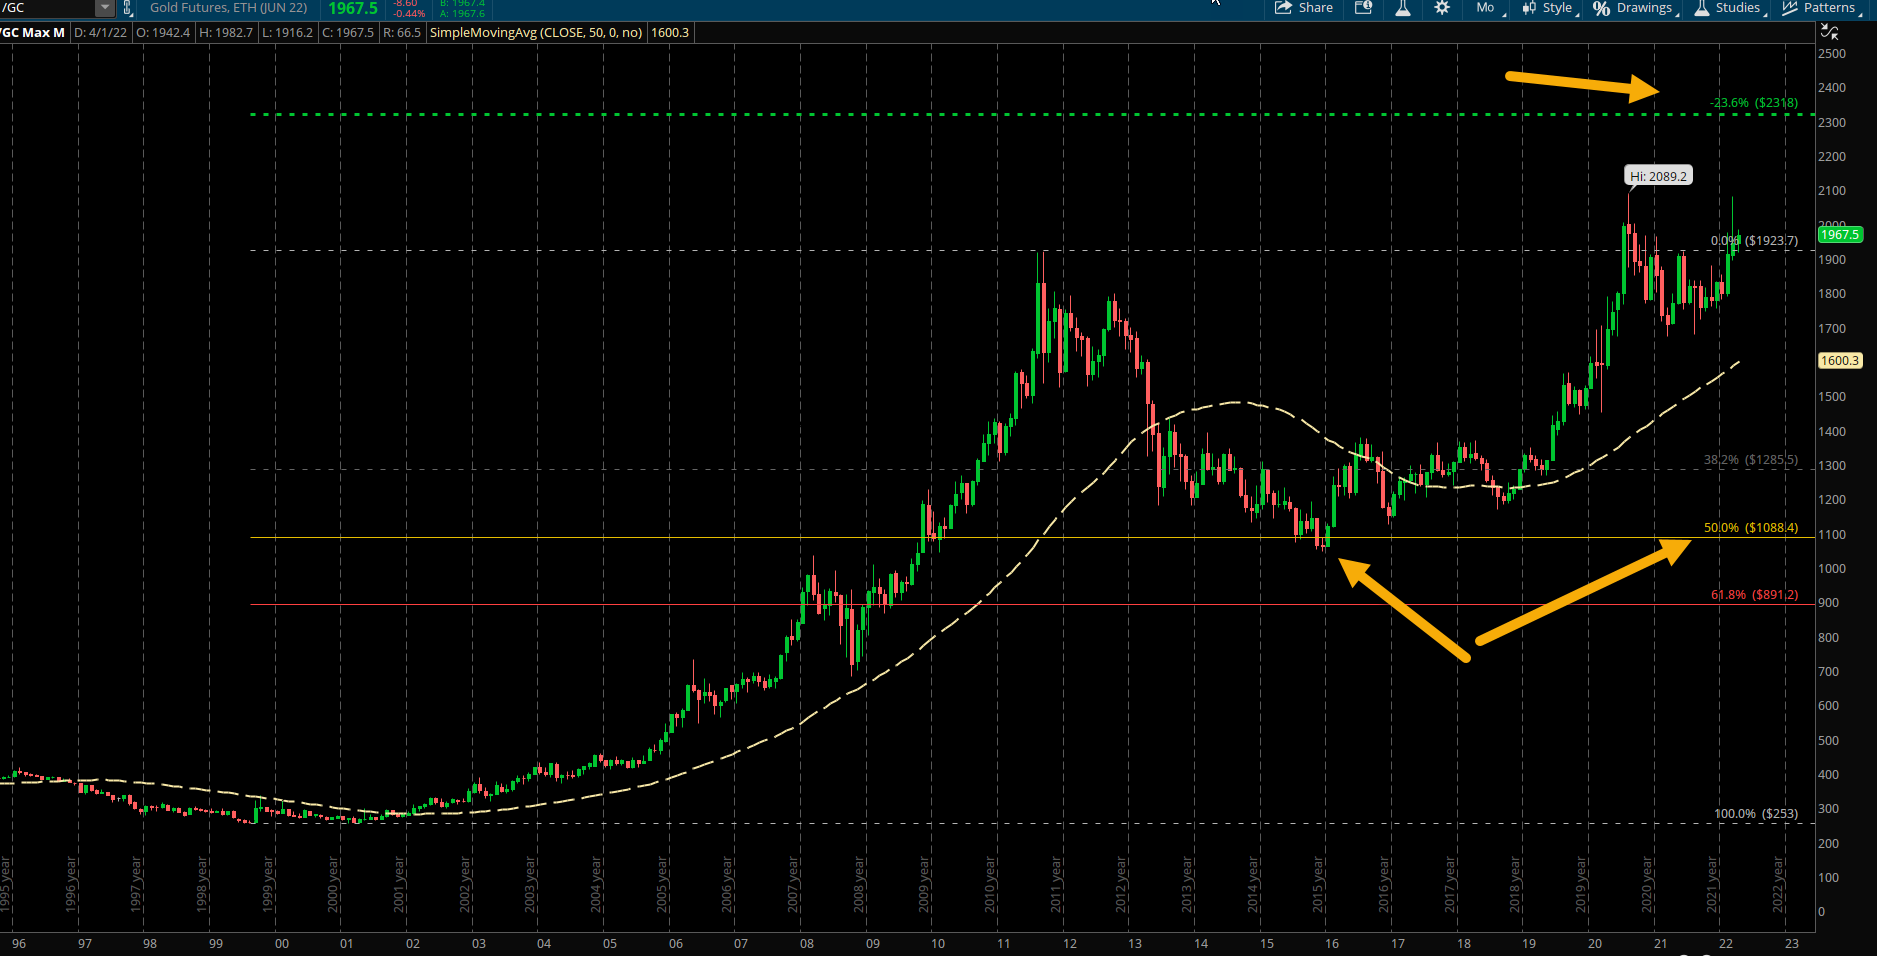
This sort of retracement analysis works on all timeframes from intraday charts all the way up to very long monthly charts such as the gold futures example below. This 25 year chart of gold prices shows the massive bull market run in the early 2000s and then the subsequent peak in 2011 when everyone was seeing commercials on TV talking about buying gold coins, etc. The bear market that followed into the lows of December 2015 made many people think gold was never going higher again and if you remember the headlines in 2015, they were littered with sure bets that gold was going to crash under 1000 or what not. However, if you simply measured a fibonacci retracement from the lows in 1999 to the highs in 2011 you would have seen the potential for gold to find support at its long term 50% retracement level near 1088. That didn’t mean it would or it was a sure thing but it offers a level to watch for evidence of a change in trend. Amazingly gold prices bottomed at 1045 which was just 4% off the halfway back retracement on this very long term timeframe. Since that low over 6 years ago, gold has ascended to new highs and is currently near 2000 approaching its big -23.6% fib target at 2318. On a timeframe so large like this monthly chart these price levels and targets can take 5-10 years or more to play out. Measuring market moves and seeing the importance of where trends have a high probability of turning can be extremely powerful.
Common Fibonacci Ratios in Thinkorswim
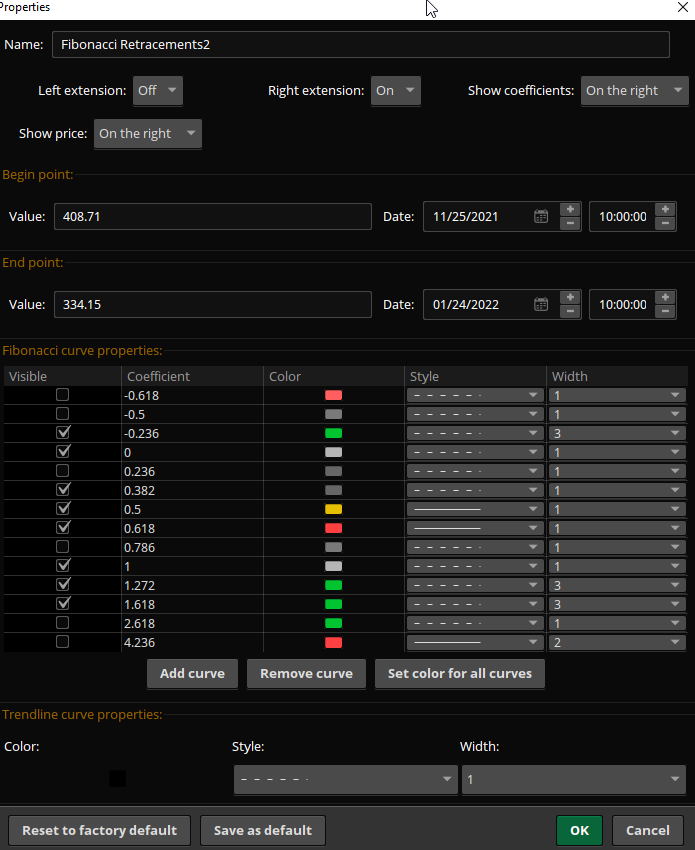
Every major charting software platform has access to fibonacci tools and some even automate a lot of this for you. Thinkorswim is my primary platform I use each day and the Fibonacci tool as shown below can be customized to draw whatever ratios and Fib numbers you prefer. The curve coefficients can be added or deleted but the primary ones I use are shown in the check box and I prefer to see a solid line on the 50% and 61.8% lines while dashed lines on the lesser weighted ones I like. A Lot of this is personal style preference and how you like to view them but the coefficients of Fib numbers range from the retracement levels such as 38.2% and 61.8% to the extension levels of 1.272% and 1.618%, to even the negative fib numbers mentioned above such as -23.6%.
What are the Primary Fibonacci Extensions Used?
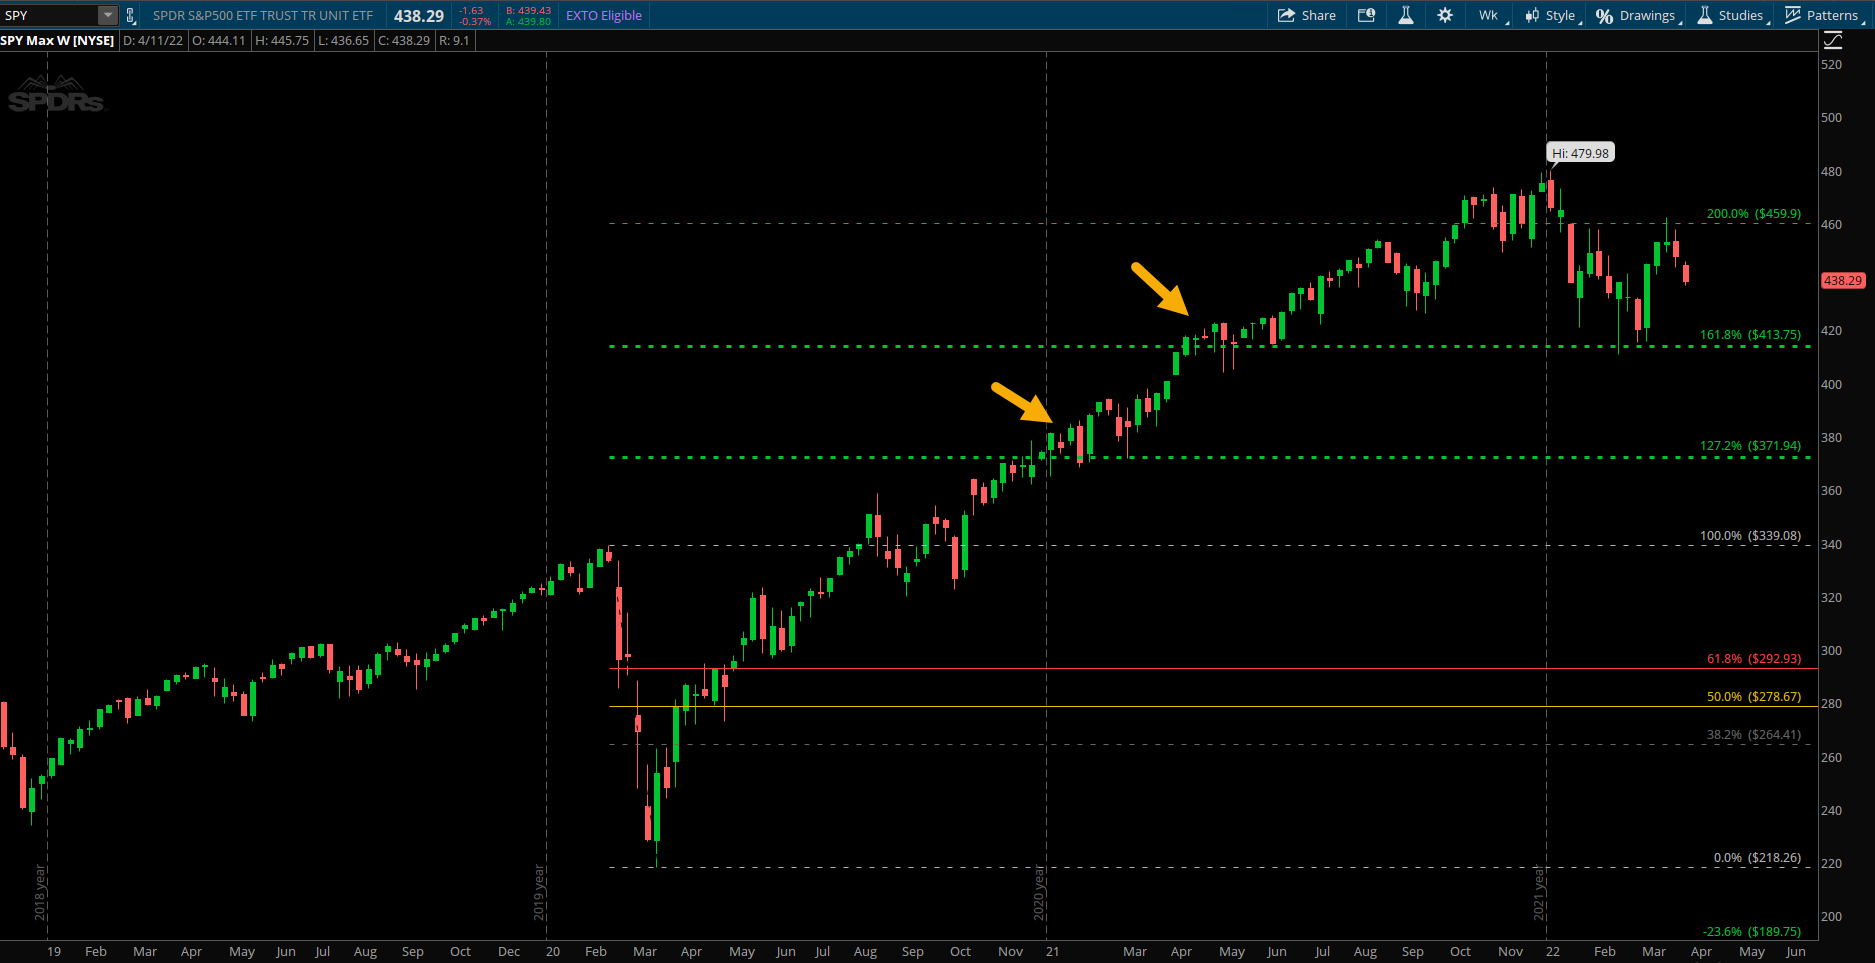
It would probably be more ideal if I focus on retracements first and in a different follow up post discuss fib extensions, and other fib factors. But overall fib extensions include the 1.272, and 1.618 levels and can even see 2.618 used in come extreme trend examples. One simple way I use the extensions is for target levels when a stock is making all time new highs. Once a stock has fully retraced a former move, meaning rebounding from a correction or downfall. Then a trader can project where the next move can ‘extend’ to using a Fibonacci extension. This is done by simply drawing from the start of a move to the end and seeing the 1.272% and 1.618% levels. Some might also use the 1.382% extension level but I have always preferred the first two. The SPY weekly chart below shows a good example from the strong bull market rally after the COVID crash in 2020. The SPY retraced back to its former highs and the 1.272% extension target sat at 372 roughly. This level was reached by the end of 2020 and served as a ‘sticky zone’ of resistance for a few months until prices could break through and move to the next fib extension at 413.75. Again this level served as a sticky level where prices slowed down and even went sideways to down for several weeks at the second arrow. Extensions can serve as profit targets or simply levels where a potential pullback may materialize.
Takeaways:
- In the fibonacci sequence after 0 and 1, each number is the sum of the two prior numbers.
- 1.618 refers to the Golden Ratio or Golden Mean.
- The most common ratios used when measuring a retracement are the 38.2%, 61.8% and 50% levels.
- The 61.8% retracement level can be viewed as the last line of defense in an ongoing trend. If prices break at that level, the validity of a trend becomes more suspect.
- Combining other tools or indicators at specific fib levels of interest can make them more powerful as a cluster of evidence pointing in the same direction shows much better conviction.