Moving Average Crossovers to Trade Momentum
In the previous post I made about Using Stacked Moving Averages to Ride Trends I showed how I like to use the trend of exponential moving averages to take advantage of trading trends and being able to stay in them as long as possible. Now I want to discuss another form of moving average analysis that is useful for seeing the start of a new trend and the end of a former one: Crossovers.
Moving Average Crossovers
Every technical study out there is some kind of derivative of price or volume so it’s important to know why you are using it. For exponential moving averages I am interested in seeing the structure of a trend that is developing and watching for how it influences momentum in the underlying stock. If a stock breaks a key technical level on a chart, that accompanying EMA cross higher tells me the momentum is shifting because a key level was breached. This type of crossover matters much more than one that occurs while the stock is stuck in a range or value area. This is because the crossover is confirming momentum happening and that tends to lead to trend continuation. Any combination of EMA’s can be used but for example purposes I will touch on my favorite short term combo of the 8/21 EMA.
Finding Setups using 8/21 EMA Crosses
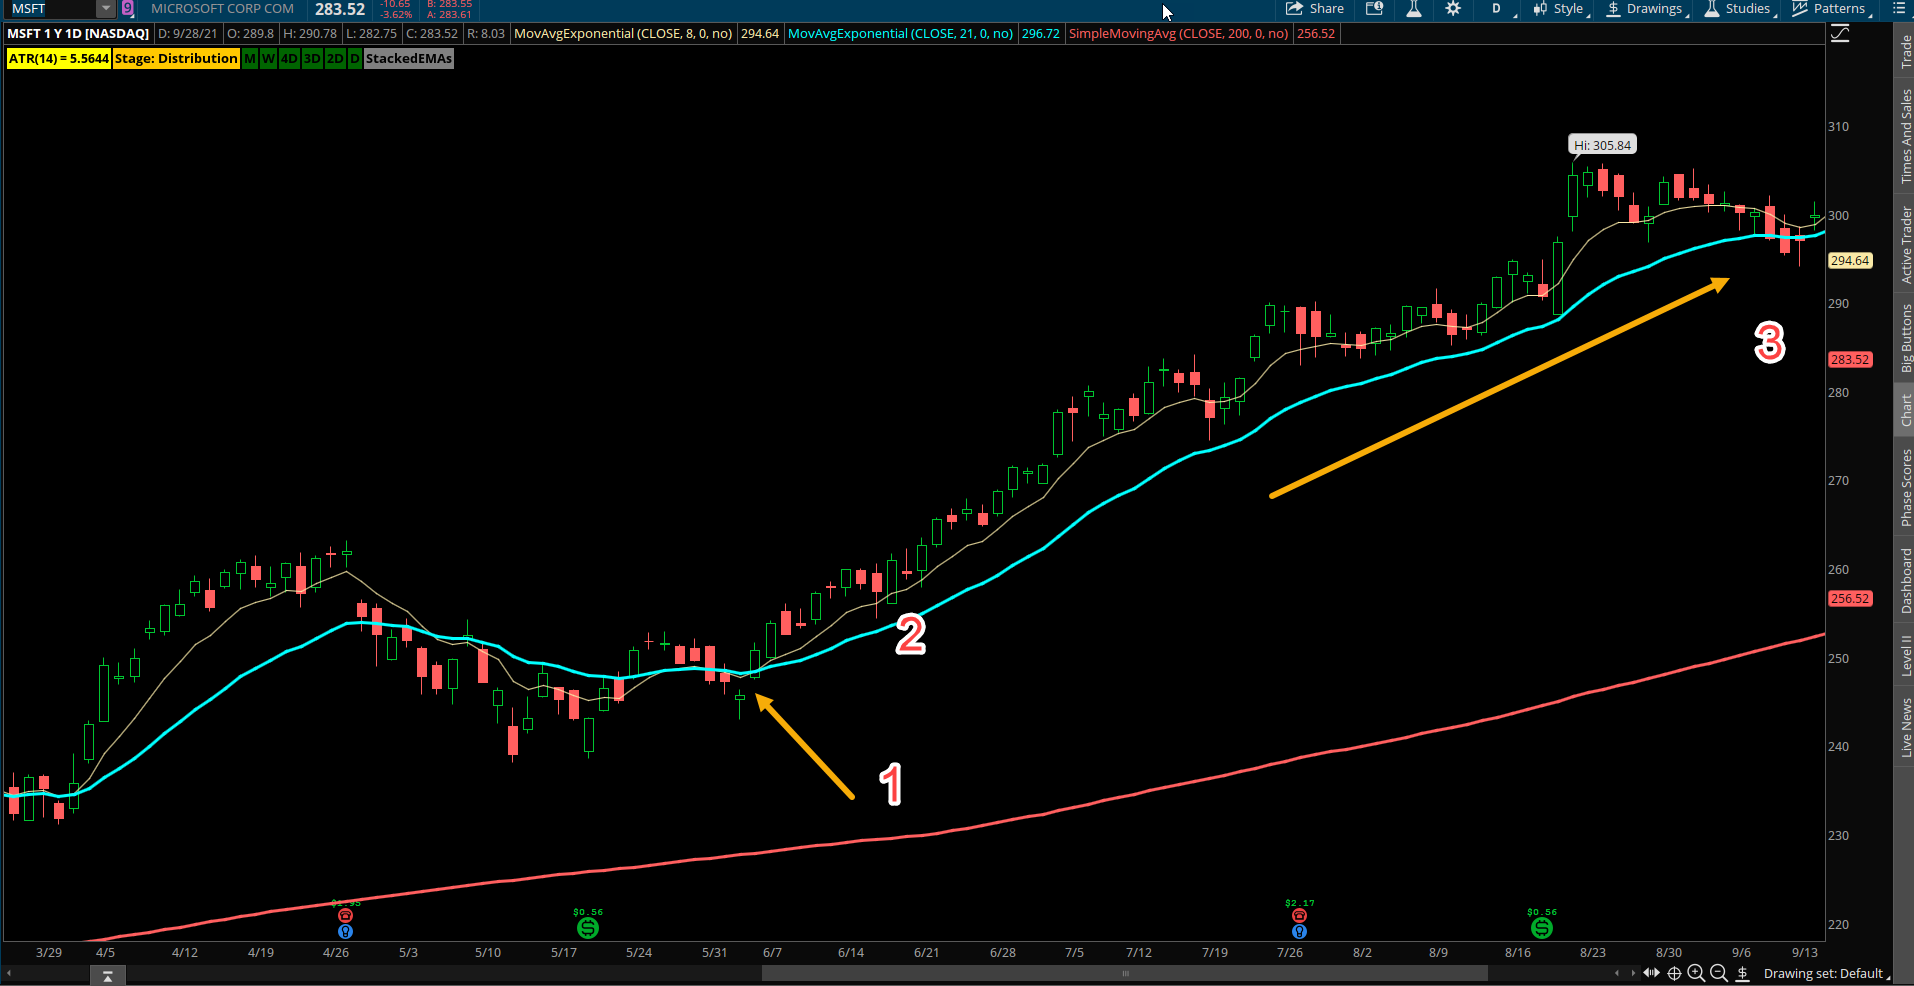
The short term 21 EMA is a solid measure of trend on a swing trade basis as there are roughly 21 trading days in a typical month and it’s also a fibonacci number which makes it interesting to traders. Looking for setups when the 8 EMA crosses above or below the 21 EMA is a useful way to show trend shifts and focus on entry points. One way to trade this as a setup is to wait for the 8 to cross the 21 and wait for the next pullback to the 8 EMA to buy with a limit order. This way you get your entry price you want as a new trend begins. The aggressive stance would be to look for price to see a close above the 8/21 EMA’s once they cross and then go long immediately after that day close. The example with MSFT below shows at point 1 where the 8/21 EMA saw a bullish cross up. Buying the next pullback to the 8 EMA would occur at point 2. MSFT then held that support and rallied for several weeks above its uptrending 8/21 EMA’s until price finally closed below the 21 EMA at point 3. While a stock can wiggle around day to day and week to week, the slope and trend of its key moving averages is what matters and strong trends like this clearly show it.
Exit Plans to Manage Risk
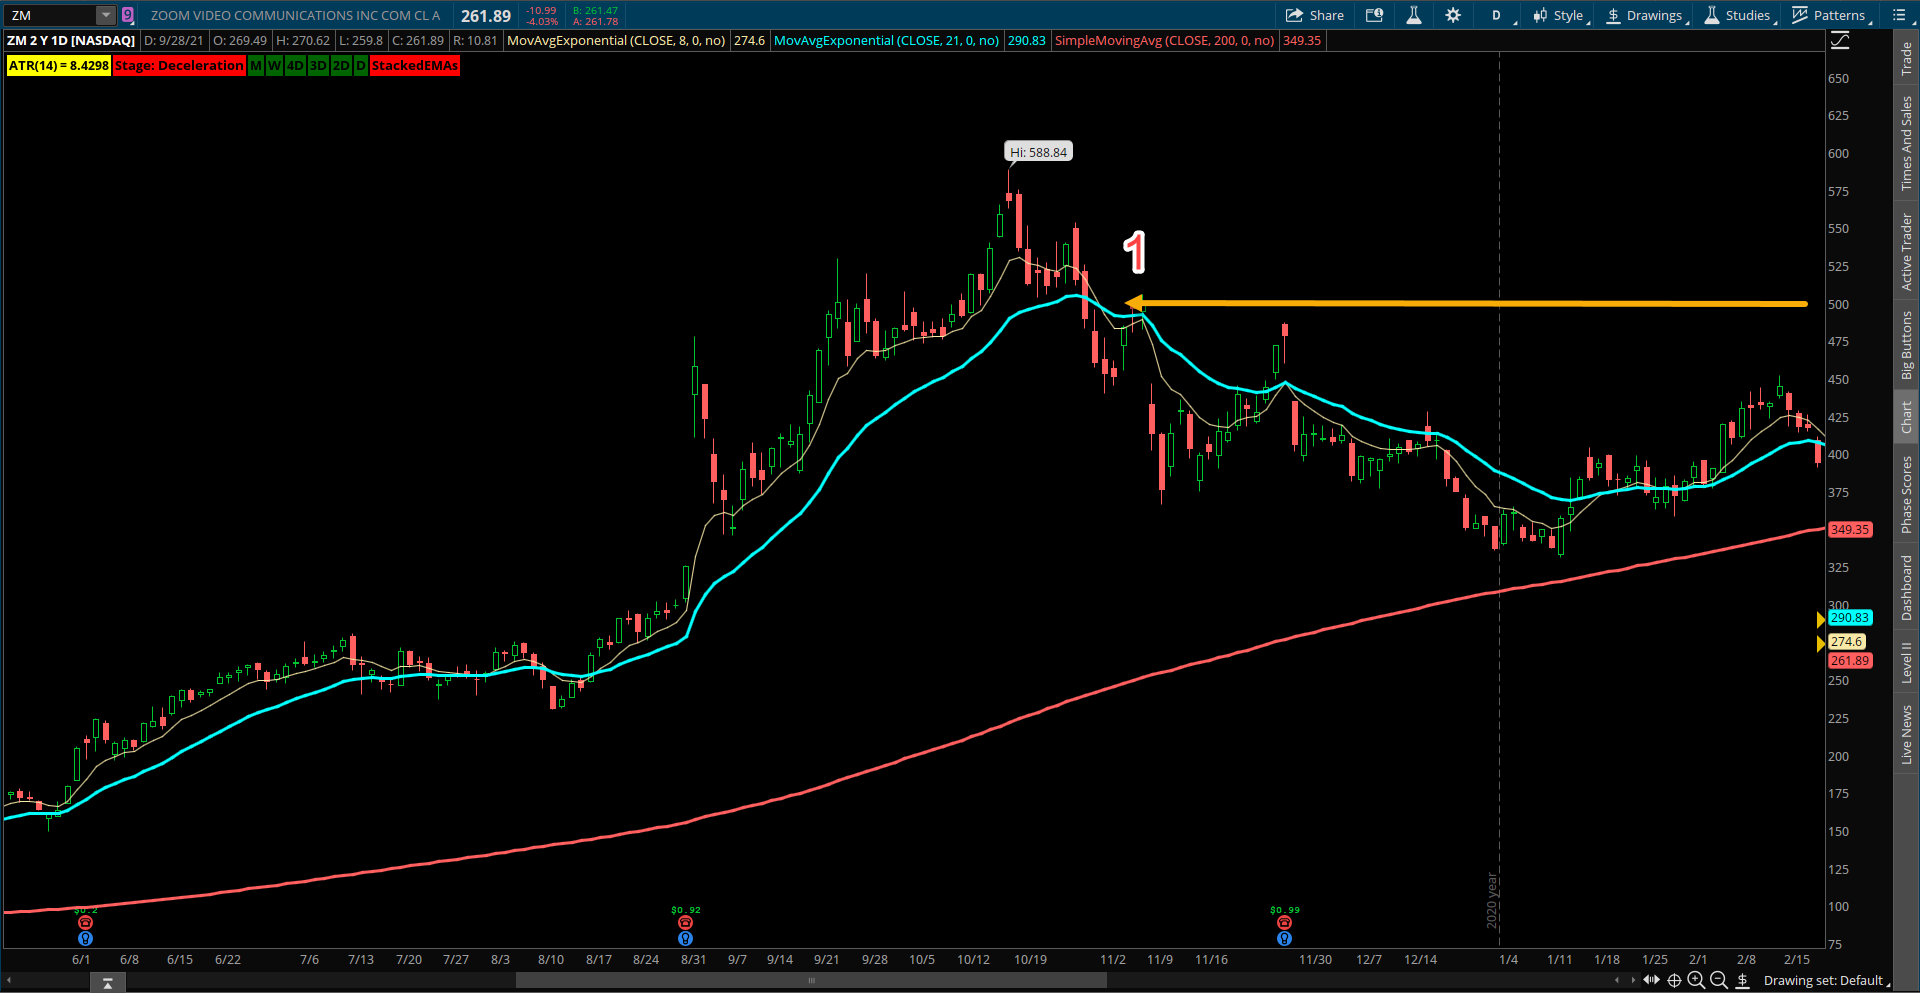
Generally I like to use the 21 EMA as a trailing level to exit a position once the stock has closed below for at least 2 days. But using crossovers to the downside can also be a simple way to use EMA crosses to manage risk while in a trade. You will never catch the top of bottom of a trend move this way but that shouldn’t be the goal when trend trading. The example below of ZM shows at Point 1 when the 8/21 EMA crossed bearish on the daily timeframe. ZM was one of the ultra high flyer momentum stocks of 2020 and peaked out at 588. Understanding when the momentum shifted would have warned you to stop buying the dip and instead focus on other stocks or even sell the rips in ZM. This bear cross happened just under 500 and the stock eventually fell lower to the mid 300s before any new EMA crossovers.
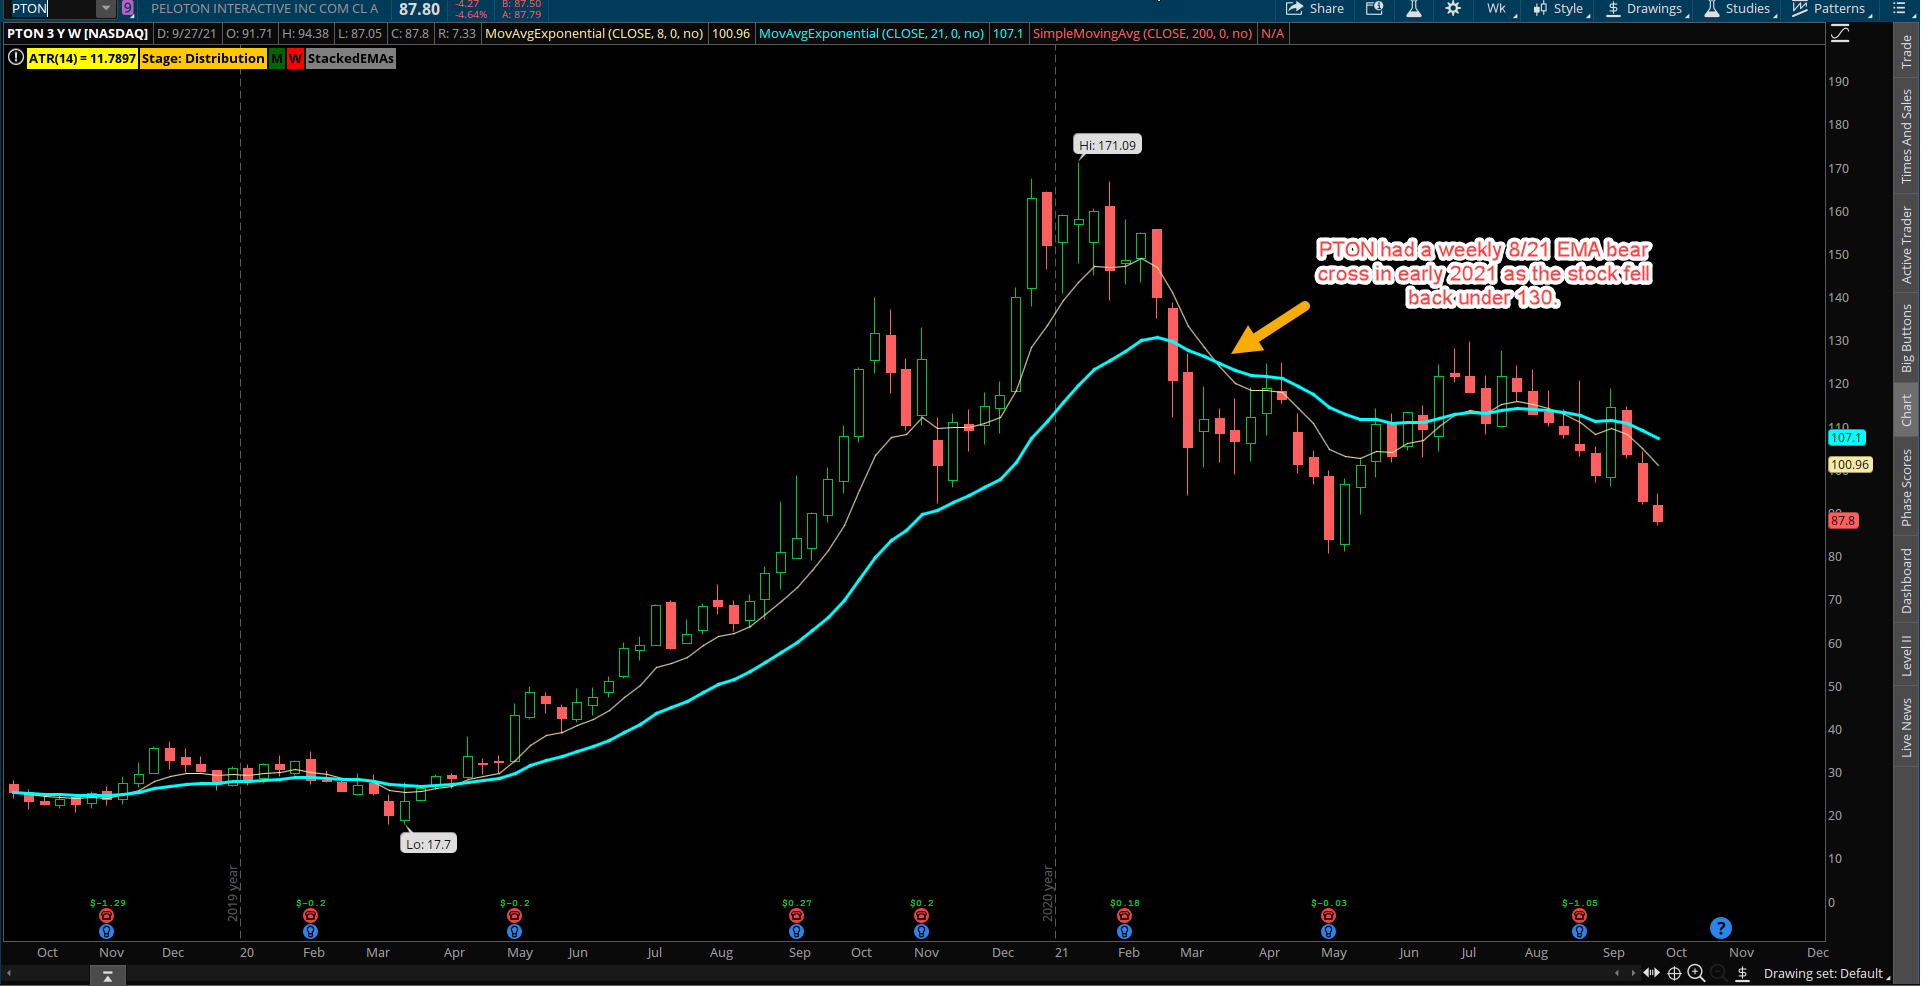
Momentum growth stocks are fantastic to ride as the trend continues and especially if following the trend on a weekly timeframe as it can last for months or even years. But I really like using the 8/21 EMA on a weekly chart to avoid being on the wrong side of momentum when it ends. Usually the first signs of momentum changing on the weekly charts (or any time frame) is a close below the 8 EMA. Then if the stock closes the week under the 21 EMA it’s a red flag the uptrend is over. The 8/21 EMA is confirmation of this and generally comes quickly afterwards. The example below in PTON shows when the parabolic rally from 2020 was finished. PTON rallied from a low of 17 to 171 in less than a year and saw a steep decline to 120 where it then confirmed a 8/21 weekly EMA bear cross. This is the kind of signal that can get a long term investor out well before the bottom falls out of a trend that is done. PTON went on to decline all the way to 80 before recovering.
Long Term Monthly 5/13 EMA Crossovers
When I said these are useful on any timeframe, I even mean long term macro big picture trends off the monthly chart. Using a slightly lower combo of the 5 and 13 EMA (also fib numbers) is a great way to track trend and momentum on the monthly’s. A strong momentum market should be trending above its 5/13 EMA and only when it closes below its 5 month EMA should there be any caution of a correction developing. Using the 13 EMA as a secondary trend indicator is a great way to side step large corrections and bear markets as well. In the QQQ example below the red arrows show the last few crosses of the 5/13 Monthly EMA. It crossed negative in mid 2008 before the financial crisis and would have kept you out of markets in long term accounts until it then crossed positive in mid 2009. The Nasdaq 100 has not crossed back negative since then, a very impressive long term trend. There have been corrections along the way which are shown with yellow arrows when price closed below the 13 EMA (blue line) but a bear market would not be in place until the 5 EMA crossed below the 13 EMA.

Takeaways:
- Using exponential moving average crossovers help a trader identify the trend but also find setups for entries and exits within the trend.
- Short term EMA crossovers such as the 8/21 or 5/13 combo is best for trading momentum in stocks.
- If you are not a disciplined trader, using these EMA crossovers are an excellent way to become more disciplined using a visual cue to execute trades and manage risk.