Pactively (Passively Active) Trading High Quality Growth Stocks
I have no real planned structure as I write this and it will be a journey of me looking at a new approach allowing for capturing the “meat” of moves in high quality growth stocks.
I have long mismatched by trading process and my talents. I am excellent at fundamental research and identifying companies through rigorous analysis, comps and having a general strong understanding and vision of future trends. I will not be going into my process for identification, this has been covered previously, and I already have a strong list of candidates fitting the best-in-class criteria which I also include with our annual OptionsHawk Market Outlook.
It’s impossible to argue with the notion that time is the key to successful wealth generation, being patient and owning stocks for the long run. Instead I choose to be extremely active in moving in and out of stocks, and although very successful at it, also realize I am putting in too much work and could likely even generate better performance through a more patient approach. Often I will go on vacation for a few weeks and do very little market watching and tend to come back to very strong gains for the stocks I felt comfortable holding as I went away, which should tell me all I need to know. Time after time I will look at one of my favorite fundamental stocks hitting new highs and think to myself, why did I just not stick with it, there is a clear benefit from a returns perspective, mental health perspective and the opportunity cost of freeing up time with a set-it and forget-it approach.
A major driver of this mismatch is that I am monitoring markets every day live for the entire trading session and act on impulses. I am also constantly generating fresh ideas daily which creates opportunities to reallocate from ideas that are taking more time to work, lagging, or at an extended point where profit-taking looks attractive.
So, in this exercise I am looking for a way to effectively capture longer-term trend moves without constantly trading in and out of names. Instead of taking 5-10% gains on multi-day/week moves we are looking to take 25%+ annual gains that compound over many years. There are also the clear tax advantages to this strategy.
The caveats here include monitoring fundamentals remain at the heart of the strategy. If the reason for owning, the story, shifts dramatically, or weakness starts to show up in the numbers/metrics, it is worth taking a closer look and re-allocate to a better idea. I do not believe valuation, new competition, analyst notes or any of these other causes of short-term volatility are a reason to sell a stock, only if it truly starts showing up in the financials. A second caveat for potentially enhanced returns is overlaying a broader market strategy using the various criteria I have previously cited, and cover annually in our Outlook report, to identify times to be in the market or out of the market, the latter could instead of being out of the market utilize a hedging strategy to protect downside risk.
We want to use a fairly simple technical signal, or combination of signals, to identify optimal periods to be long these stocks, and when to be neutral (entry/exit) while noting we are never looking to be short best-in-class stocks when you can be short worst-in-class. This patient strategy falls back on my belief that great companies stay great driven by multiple factors, namely management teams.
One simple approach that looks effective as I scan across the high-quality growth basket of stocks is Weekly MACD, specifically the Histogram.
The Moving Average Convergence-Divergence indicator (MACD) is a model that follows the momentum of trends by showing the relationship between two moving averages of the price of a security. The default setting for this using EMAs is 12/26/9 and shows up with two lines, the MACD Line and the Signal Line. The MACD Line is the difference (or distance) between two moving averages. When looking at the indicator, the MACD Line is considered the “faster” moving average. The Signal Line is the moving average of the MACD Line. The Signal Line is considered the “slower” moving average. The Histogram simply plots the difference between the MACD Line and Signal Line. As the two moving averages (MACD Line and Signal Line) separate, the histogram gets bigger. As the moving averages get closer to each other, the histogram gets smaller. The histogram is positive when the MACD line is above its signal line and negative when the MACD line is below its signal line.
We can modify these numbers to better capture the strategy, essentially the numbers determine to sensitivity for identifying strength of trends. I prefer to utilize Fibonacci numbers when using moving averages due to historical back-testing so to fit this approach I am going to use 13/34/8 for MACD settings.
Now it is time to look at some examples of a simple approach of owning these stocks when the MACD histogram is in positive territory and exiting when it crosses to negative and being patient while ready to re-enter on a cross to positive. We are not using the lines, just the histogram. I will shade the charts green when the signal has us owning the stock and red when it says to sit patiently. I am going to leave the weekly Bollinger Bands on these charts as well as someone wanting to be even more active could look to write calls when the upper band is breached and sell puts when the lower band is breached to further enhance returns using 30-60 days until expiration timeframe. I should probably get this coded as a custom indicator in ThinkorSwim so on any chart view you immediately know if we are in buy or neutral mode.
Some may say looking at these charts with so many of these quality names at new highs, why not just do nothing, which is fine, but I think overlaying a somewhat more active approach will enhance returns via all the means previously noted as well as for allocation to names in buy signal mode from ones in neutral mode.
Shopify (SHOP)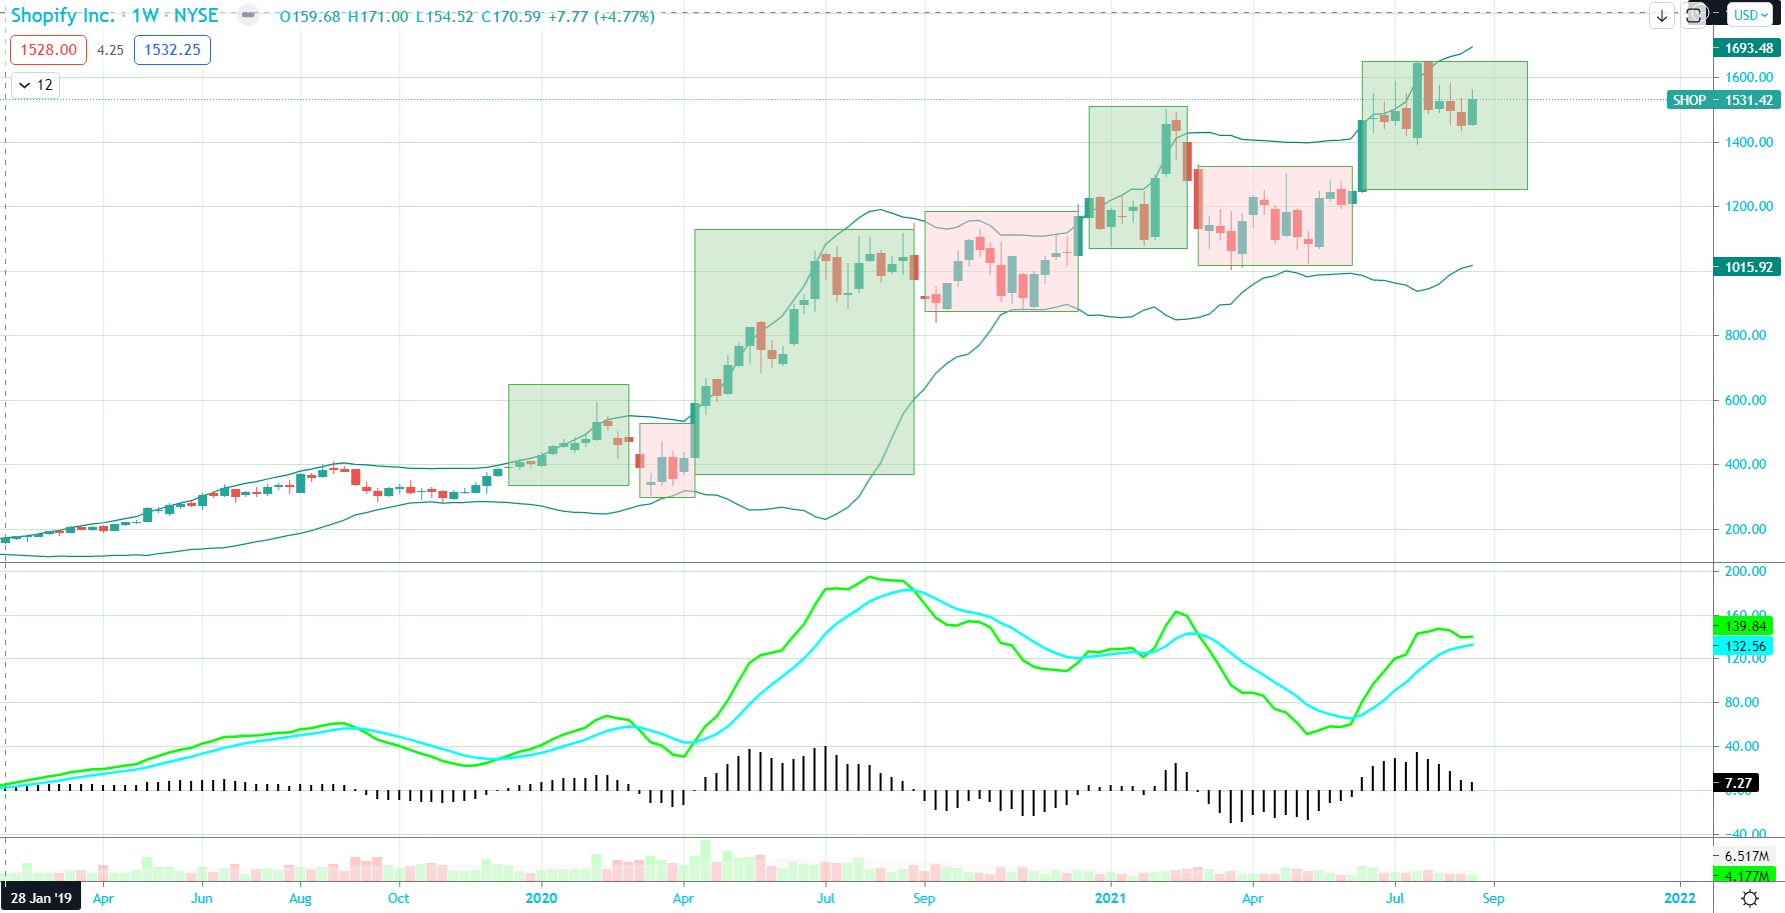
Sea Ltd. (SE)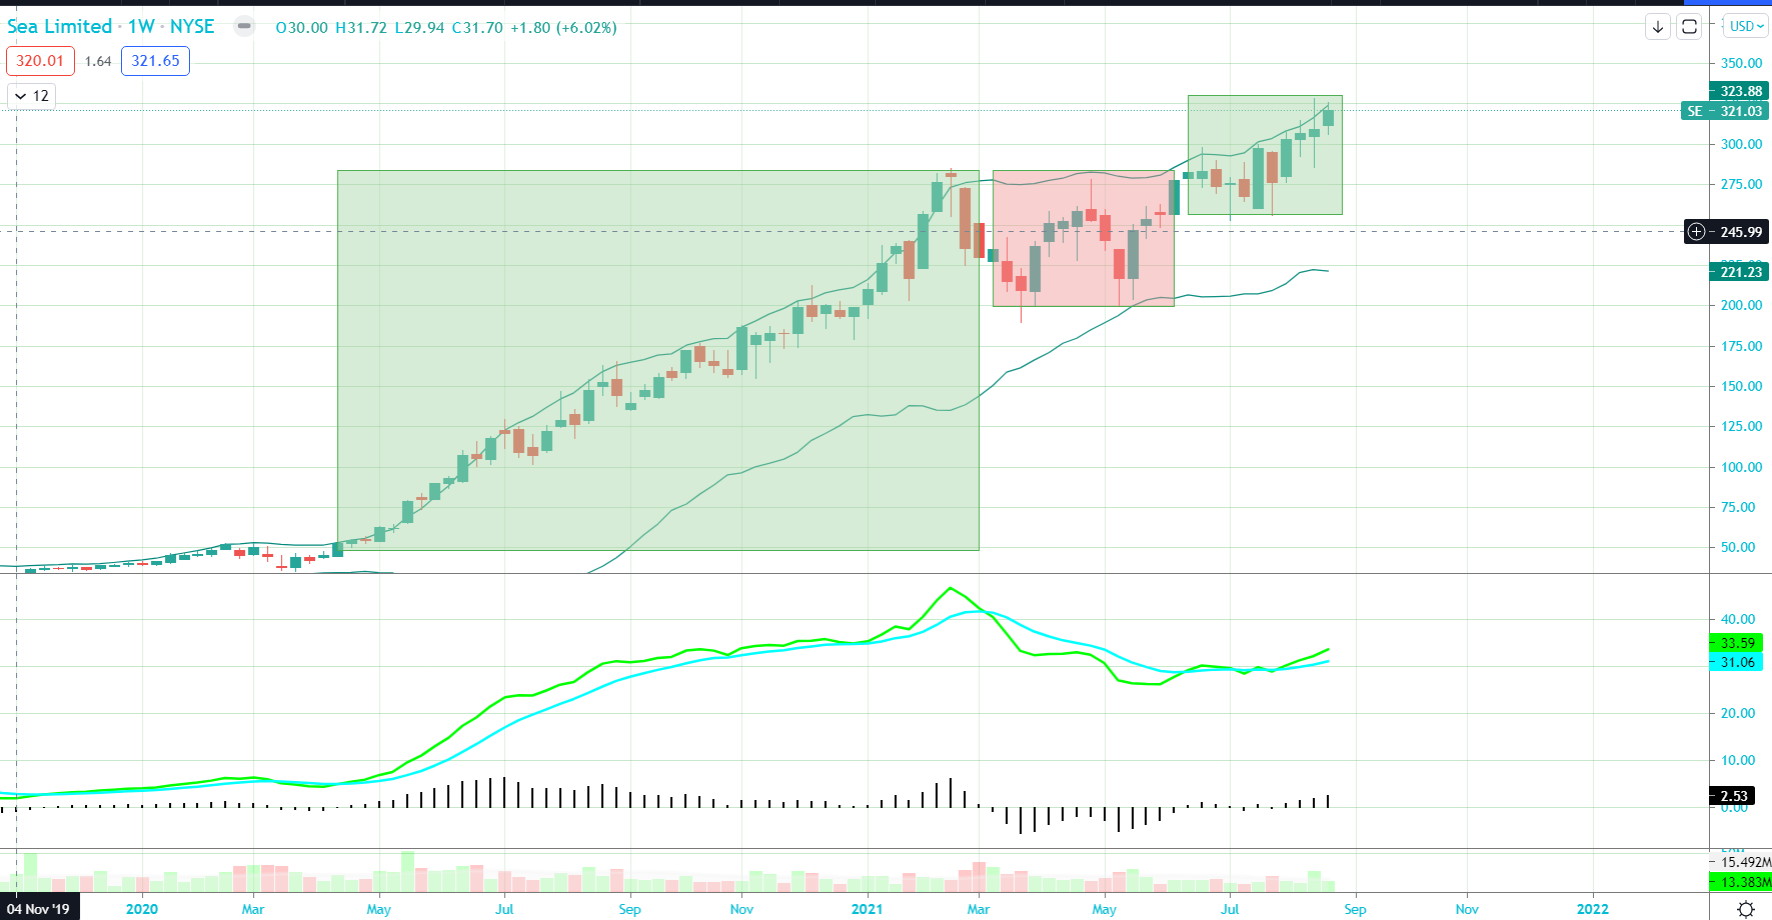
Intuitive Surgical (ISRG)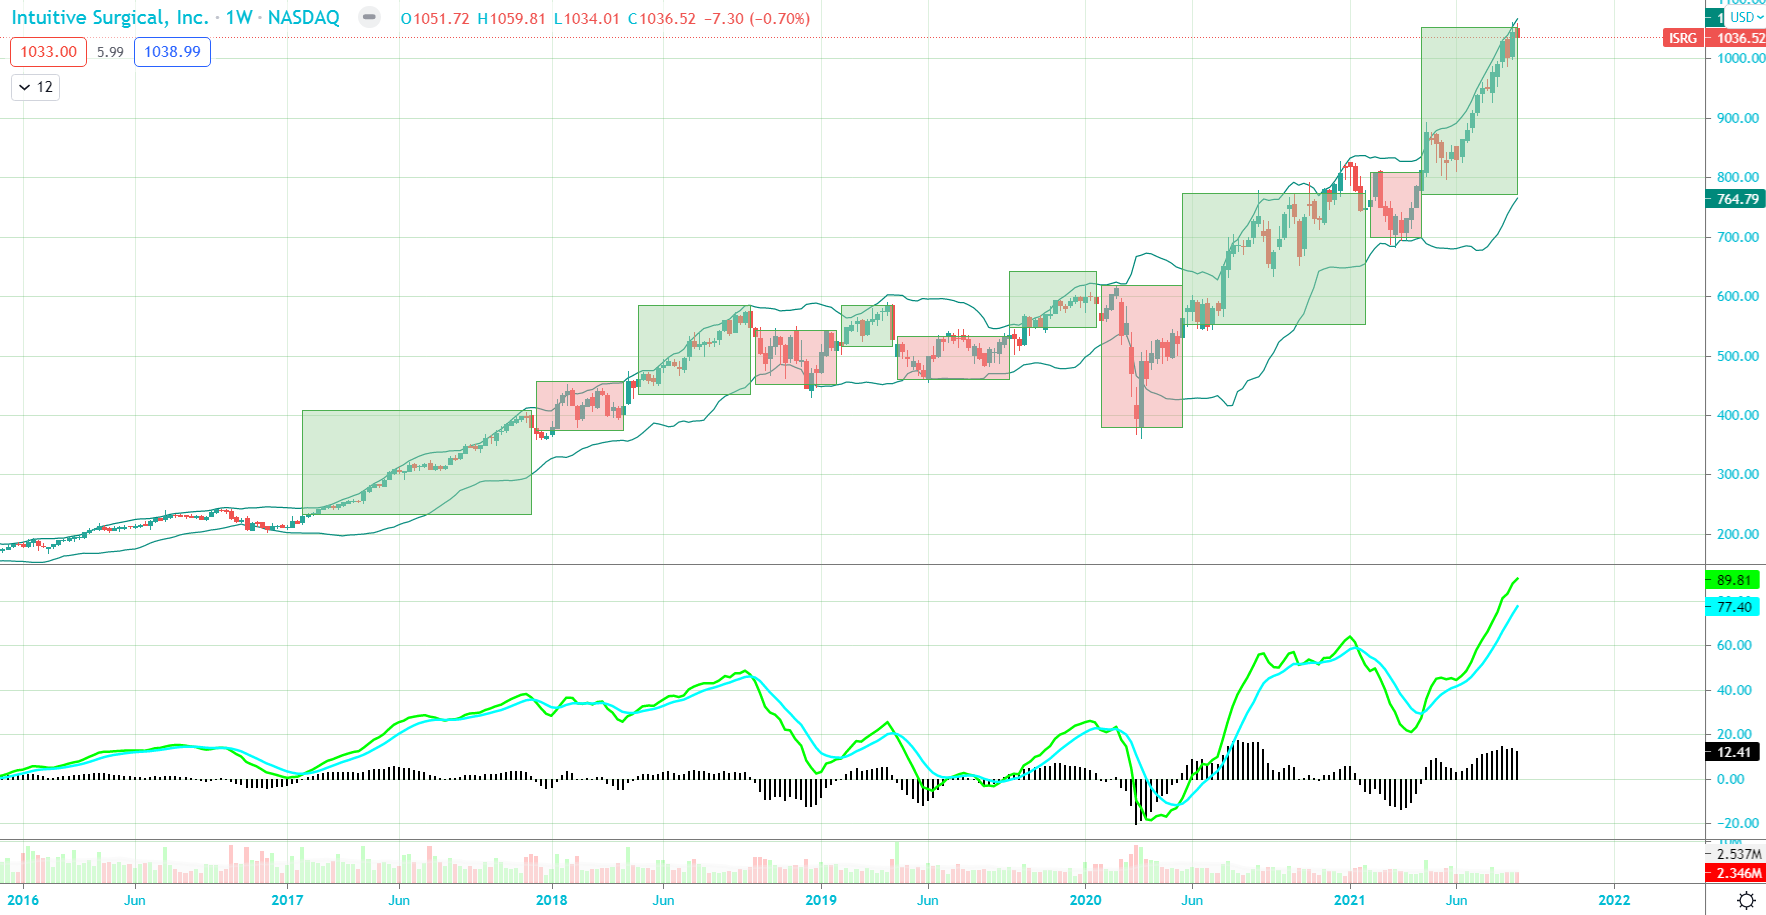
Service-Now (NOW)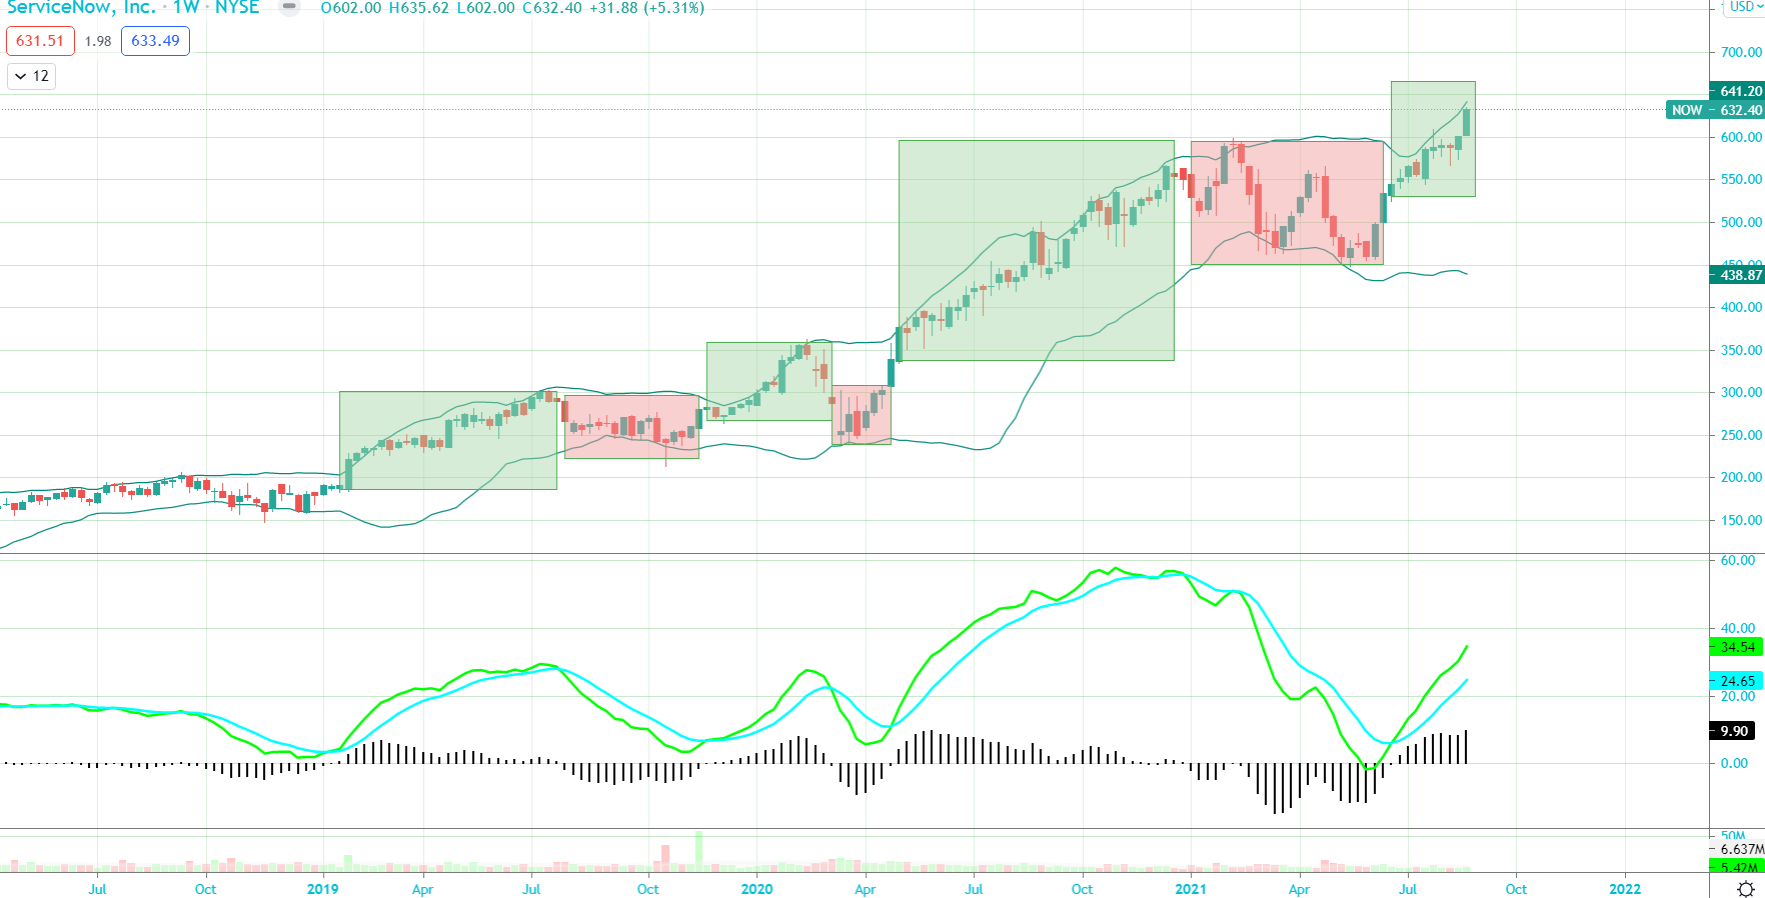
Carvana (CVNA)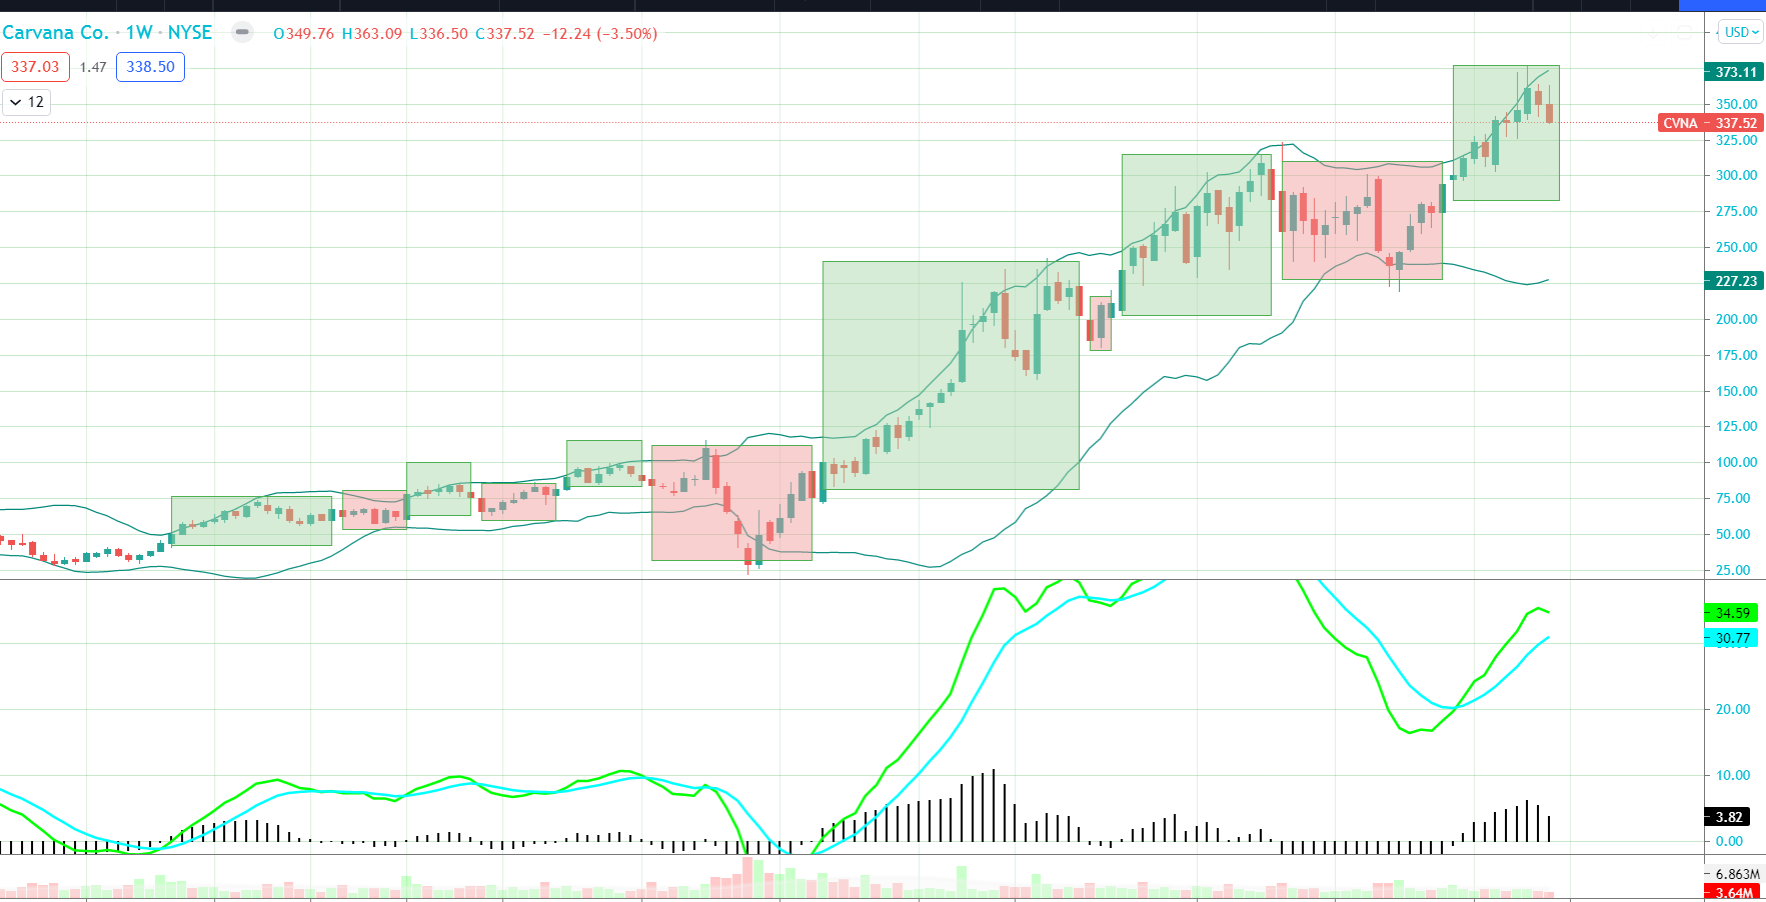
Chipotle Mexican Grill (CMG)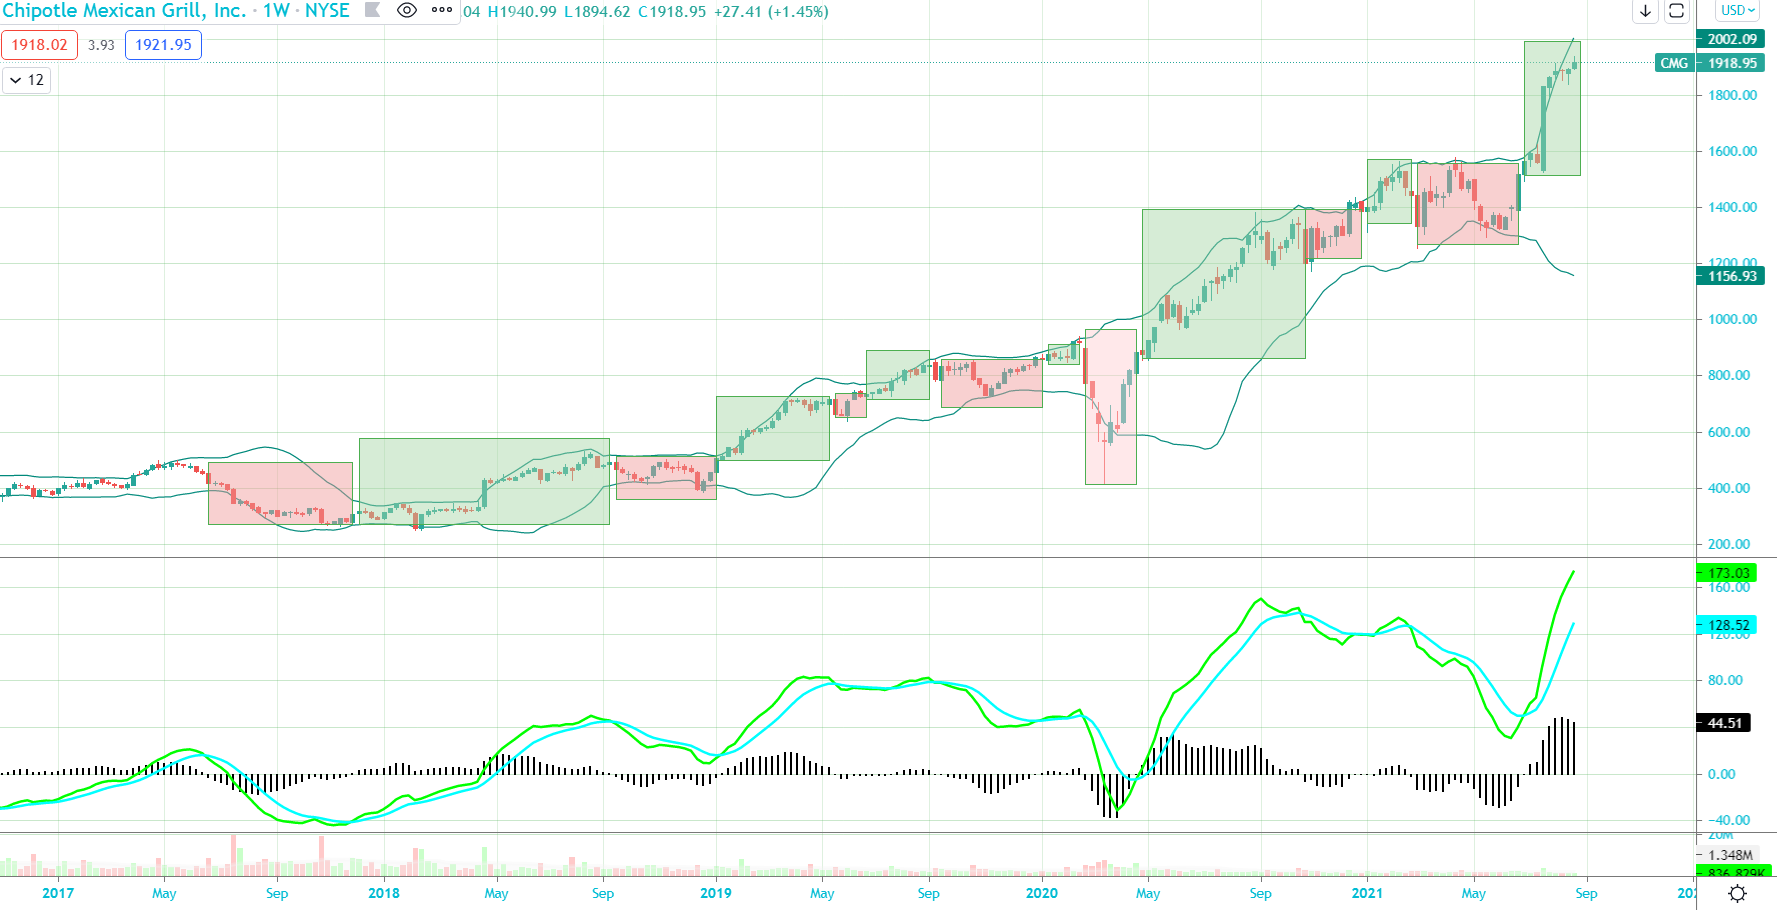
I ran through more than hundred examples and the method certainly appears to capture the majority of big uptrend moves while stays neutral during weaker and consolidation periods, which makes sense as it is all based off a momentum-driven indicator.
I think this simple indicator can be extremely useful while overlaying some of the ideas presented earlier using a market-model and utilizing options can further enhance returns for a longer-term oriented portfolio. There are likely further improvements/enhancements that could be used with this indicator alone as well as combining with a secondary writing but that will have to be for another time.