Trading with Trendline Analysis
In my recent post on Support and Resistance I pointed out some great ways I like to evaluate key price levels for inflection points and how to anticipate where buyers or sellers might be present. Another extension of this type of chart analysis is using trend lines. Since technical analysis is based on the assumptions that trends exist, trend lines are a popular way to simply visualize a trend in a stock and can be important for confirming the end of an existing trend or the start of a new one.
Uptrend Lines
With any trend line you need two connecting points at minimum and with an uptrend line it needs to have a positive slope formed by two or more low points on a stock price chart. Naturally the second low, or third low if there is one, will be higher than the first. A trend line with 3 low points is considered more valid and strong as a true trend line. These uptrend lines can act as support and show that demand increases each time price comes back to the trend line. As long as prices remain above the trend line, it’s considered a trend controlled by buyers and increasing demand. A break beneath the uptrend line would show that demand has weakened and a potential change in trend is starting.
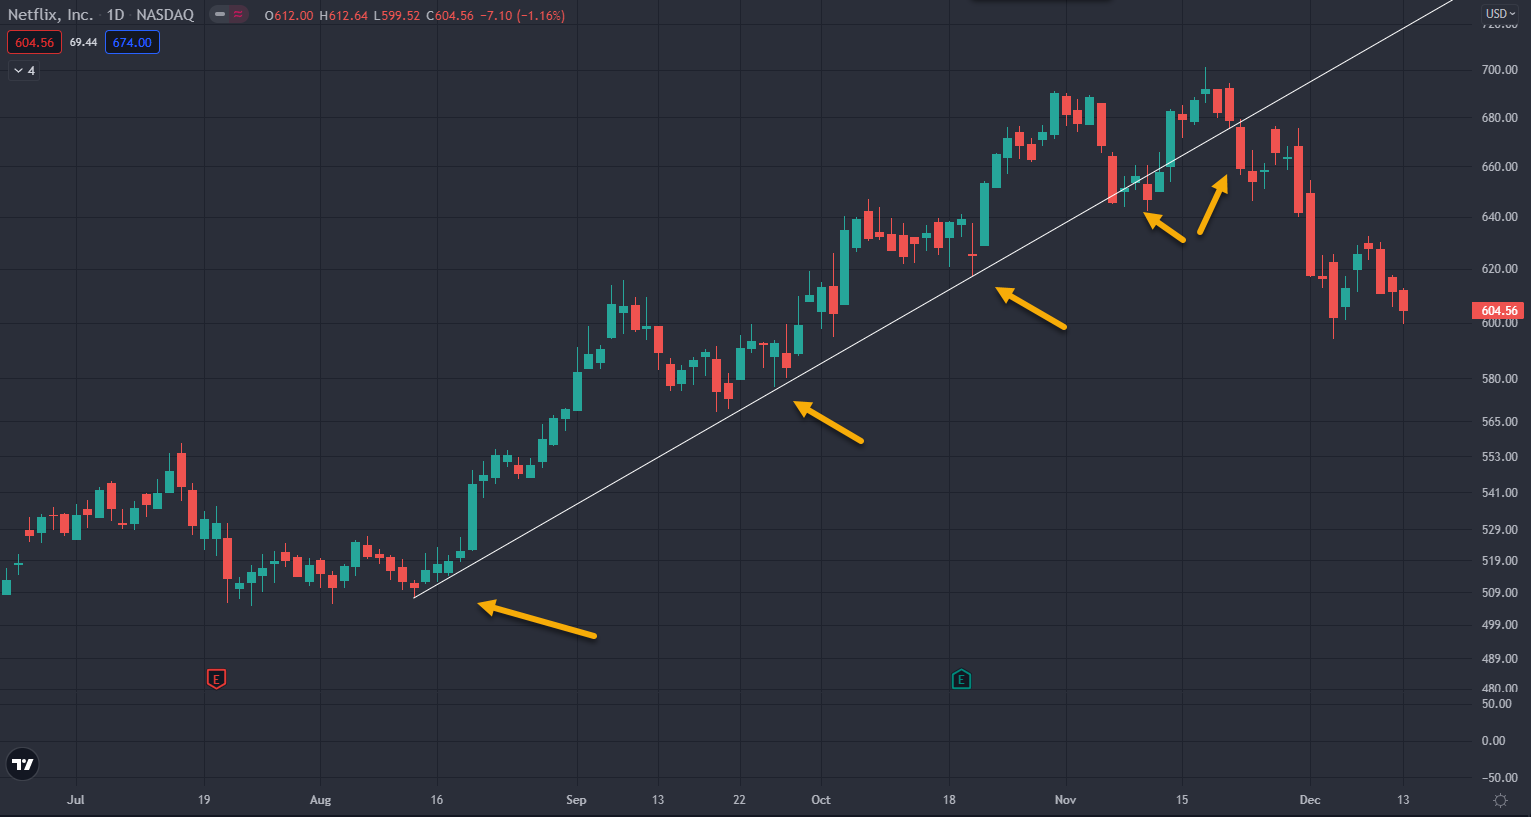
As the chart of NFLX shows below there was a valid trend line for the stock from mid August into late November as price rose from 520 to nearly 700. Each arrow represents a connecting low point the stock formed on its way higher. Once the trend line broke and no longer provided support on the 5th retest it showed that buyers were running out of steam and a change in trend was likely. Also on the final advance towards 700, the stock warned that it wasn’t as strong since it only slightly made a higher high.
Downtrend Lines
Similar to uptrend lines, a downtrend line is formed by connecting two or more high points while exhibiting a negative slope. The second high must be lower than the first for the trend line to have a negative slope. Downtrend lines act as resistance and indicate that supply is increasing even as price declines. A declining price within a downtrend showing increased supply is bearish and showing the sellers being in control. If price were to break above the downtrend line that would show sellers decreasing and a change in trend potentially starting.
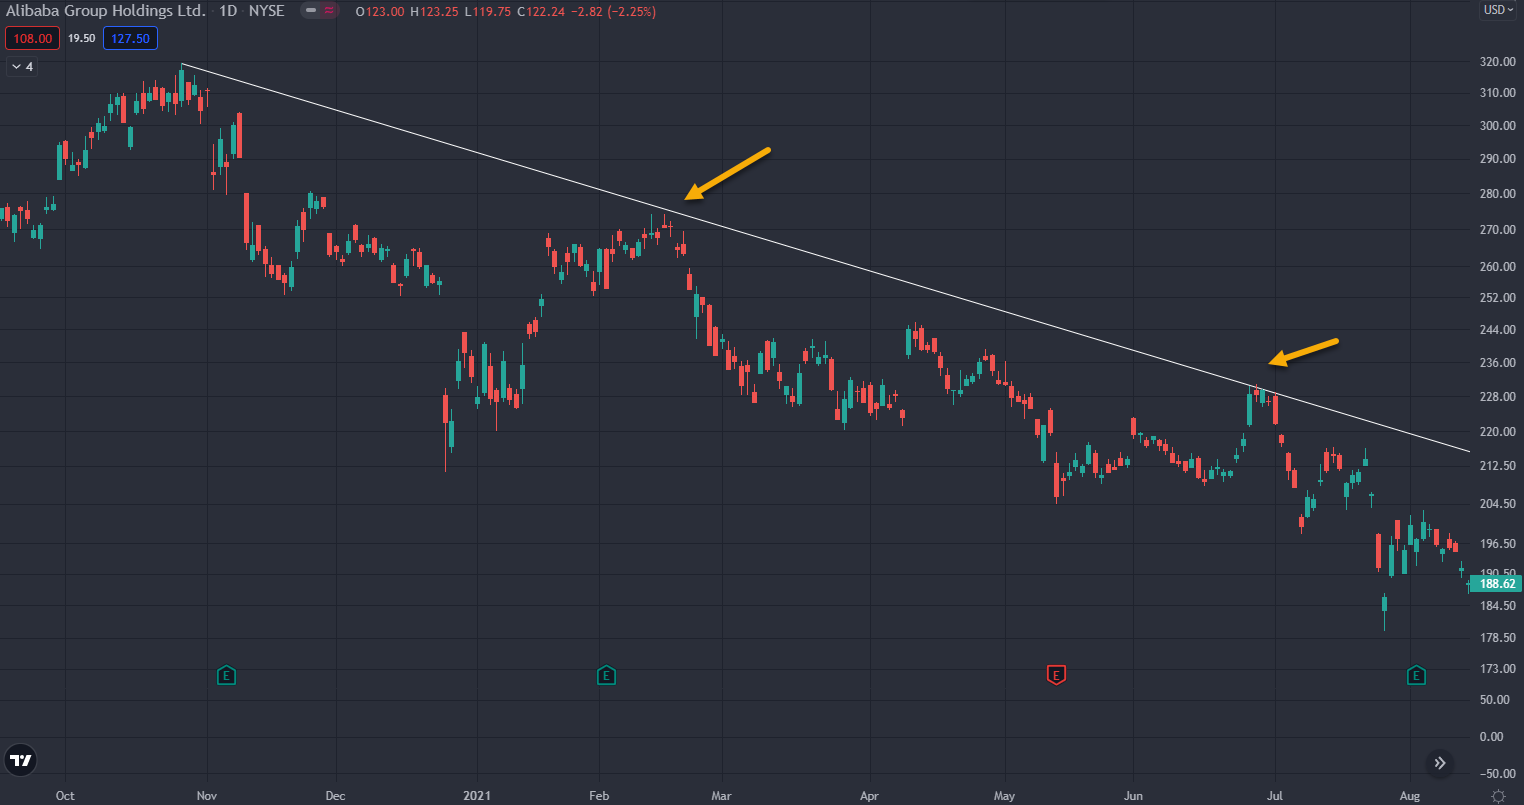
In the example below with BABA’s 2021 downtrend you can see price came back to its dominant trend line several times before hitting a ceiling of supply and rolling back over lower. The arrows show the points where BABA retests the downtrend line but there were a few occasions where price was simply too weak to even reach its trend line during this long decline throughout all of 2021.
Validation of a Trend Line
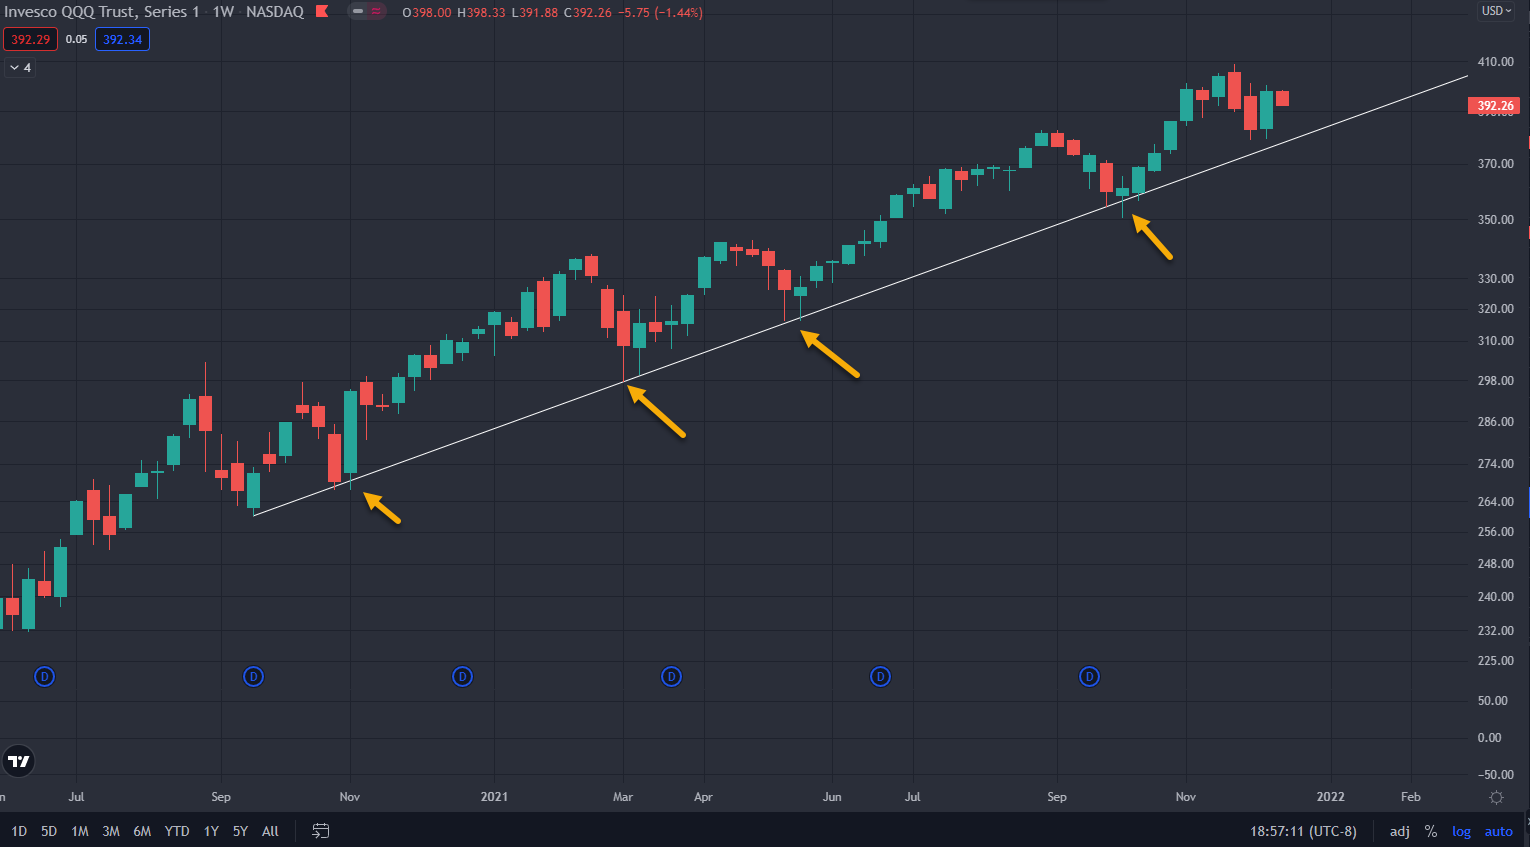
Since it takes two or more points to create a trend line, the more points used to draw the line the more valid it is and therefore the support or resistance implied by the trend line. Often the highs or lows will not match up perfectly but similar to technical analysis it’s not a science but more of an art and I find it best to use these trend lines as zones of potential support and resistance, not exact price points. Ideally you are using trend lines as visuals and confirmations of trends being intact and solid instead of actually using them as your sole entry and or exit for a trade. Just like a moving average it’s a way for me to access the steepness and maturity of a trend. The more points connecting a trend line then the more validity a trader can assign a trend line and many technical analysts like to use 3 tests of a trend as a strong way to validate its strength. The chart of the QQQ Nasdaq below shows a weekly chart from late 2020 into 2021 and the uptrend line is strong and valid because it has provided support bounces at least 3 times. Infact 4 separate times the trend line was tested and held nearly perfect. On the 4th touch the stock probed a little below the uptrend line but CLOSED back above it. Oftentimes it makes sense to wait for the close of the candle to make sure the stock is truly breaking the trend line, especially when it’s a strong trend.
Angles and Steepness
As a strong trend advances the potential exists for the steepness of the trend line to increase and even go parabolic towards the end of an up move. A steeper trend line results from a sharp rally higher in a stock and once this unfolds, the importance of support and resistance attached to the trendline becomes less valid. As volatility changes then the trendline carries less weight because the angle of a trend line is now different from when it first began. Once a stock rally gets too steep or extended from its trendline it often proves the existing trend is unsustainable and so future pullbacks to that trendline may not offer meaningful support as they formally did prior.
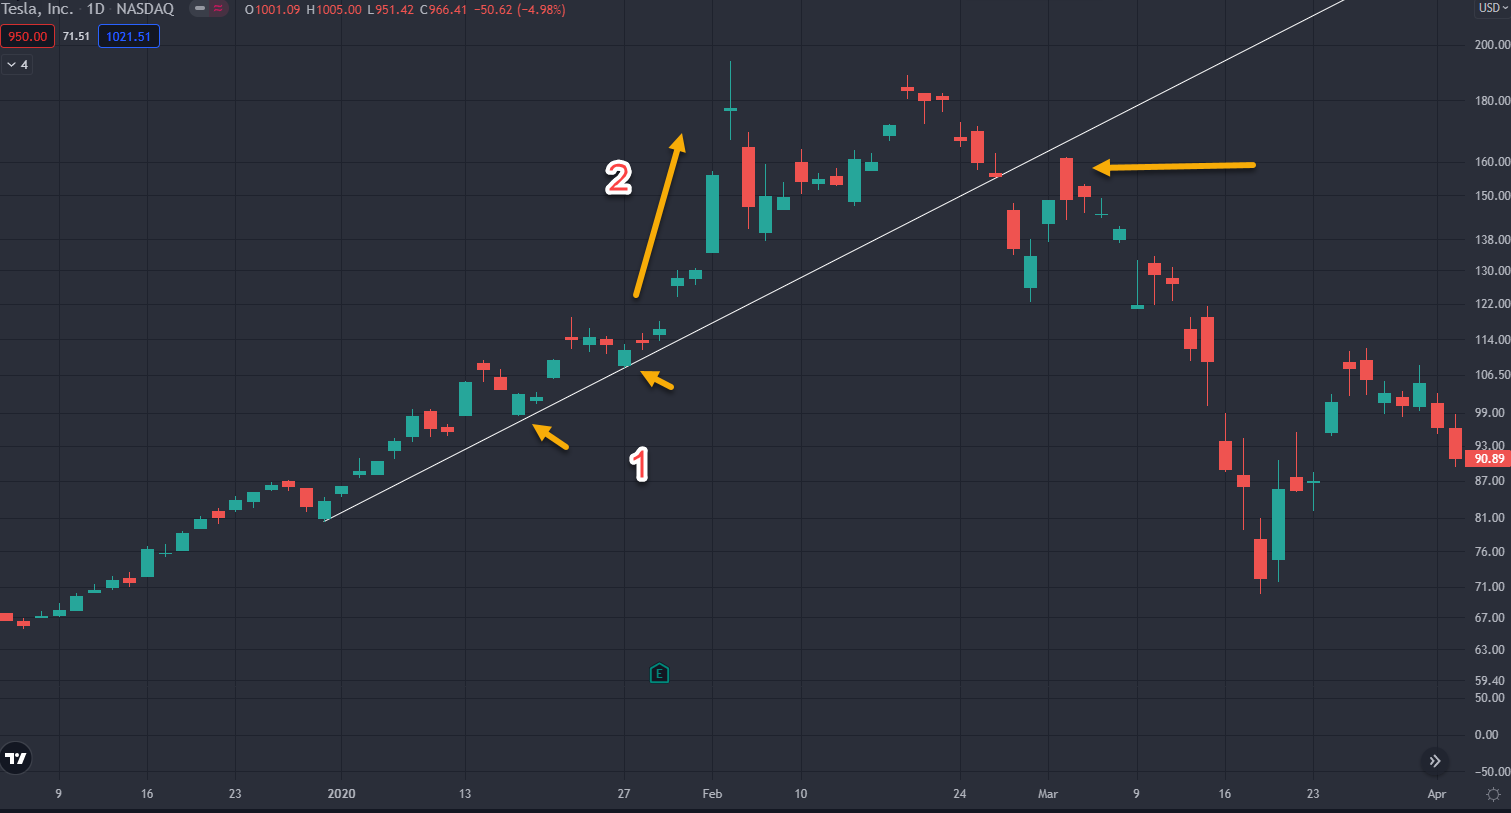
The example below shows TSLA in early 2020 during its first big parabolic uptrend. Point 1 clearly shows multiple trend line tests that held as support when buyers were in control. Then during point 2, the stock exhibits incredible buying demand and goes parabolic or vertical. This move is so far beyond the trendline that the steepness of price has now created an unsustainable angle on the price chart. Once the initial upside fades, it consolidates for a few weeks without being able to make a new high. Then as the last arrow shows, the stock dips to the uptrend line but does not bounce at all, instead gapping down below the long existing trend line that provided support for several months on the way up. The break of the trend line confirms that supply is overtaking demand and the trend has changed. But this really was based on the angle and steepness of the advance being unsustainable when buying hype peaked.
Takeaways:
- Trend lines can offer great visuals but since they are more of an art than a science it’s important to use them in tandem with other tools like horizontal support and resistance.
- A valid trendline has at least two points connecting but at least 3 points confirms a solid strong trend line.
- Trend lines are a popular form of technical analysis but like most forms of chart analysis it can be subjective based on how it’s drawn. Using them as zones, rather than exact price levels is best.
- Waiting for the closing of a candle can avoid false signals when trend lines may get probed by price but then it recovers to close back above.
- Steepness and angle of a trend line is important when judging the strength and potential for trend exhaustion.