Using Stacked Moving Averages to Ride Trends
One of the many tools you can use in trading are moving averages. But which ones? How many? Simple or Exponential? To me it really isn’t that crucial but whatever you choose it’s important to stick to that set of parameters and use them for simplifying your workflow in determining the trend of the market and new opportunities to trade. As a trend trader it really is the best way to define a general direction in which a market is developing. Moving averages can give you a quick visual of the roadmap the market has been on and where trends are likely pointing going forward. Likewise a moving average crossover can be useful in seeing when trends start to shift in the short term and give warning to change your trading bias to be bullish or bearish. For this post I wanted to focus on the concept of “stacked moving averages” and how to interpret them.
I prefer using exponential moving averages (EMA’s) as opposed to simple moving averages, although at times it’s good to know where the 200 day simple moving average is since it is widely watched by media and overall market participants. An exponential moving average is a weighted average that assigns greater weight to the most recent data. So an EMA will always focus more on “what’s going on right now” as opposed to the broad simple moving averages showing the “big picture” taking each price of that period of days and dividing evenly to form an average price.
Stacked EMA’s using Fibonacci
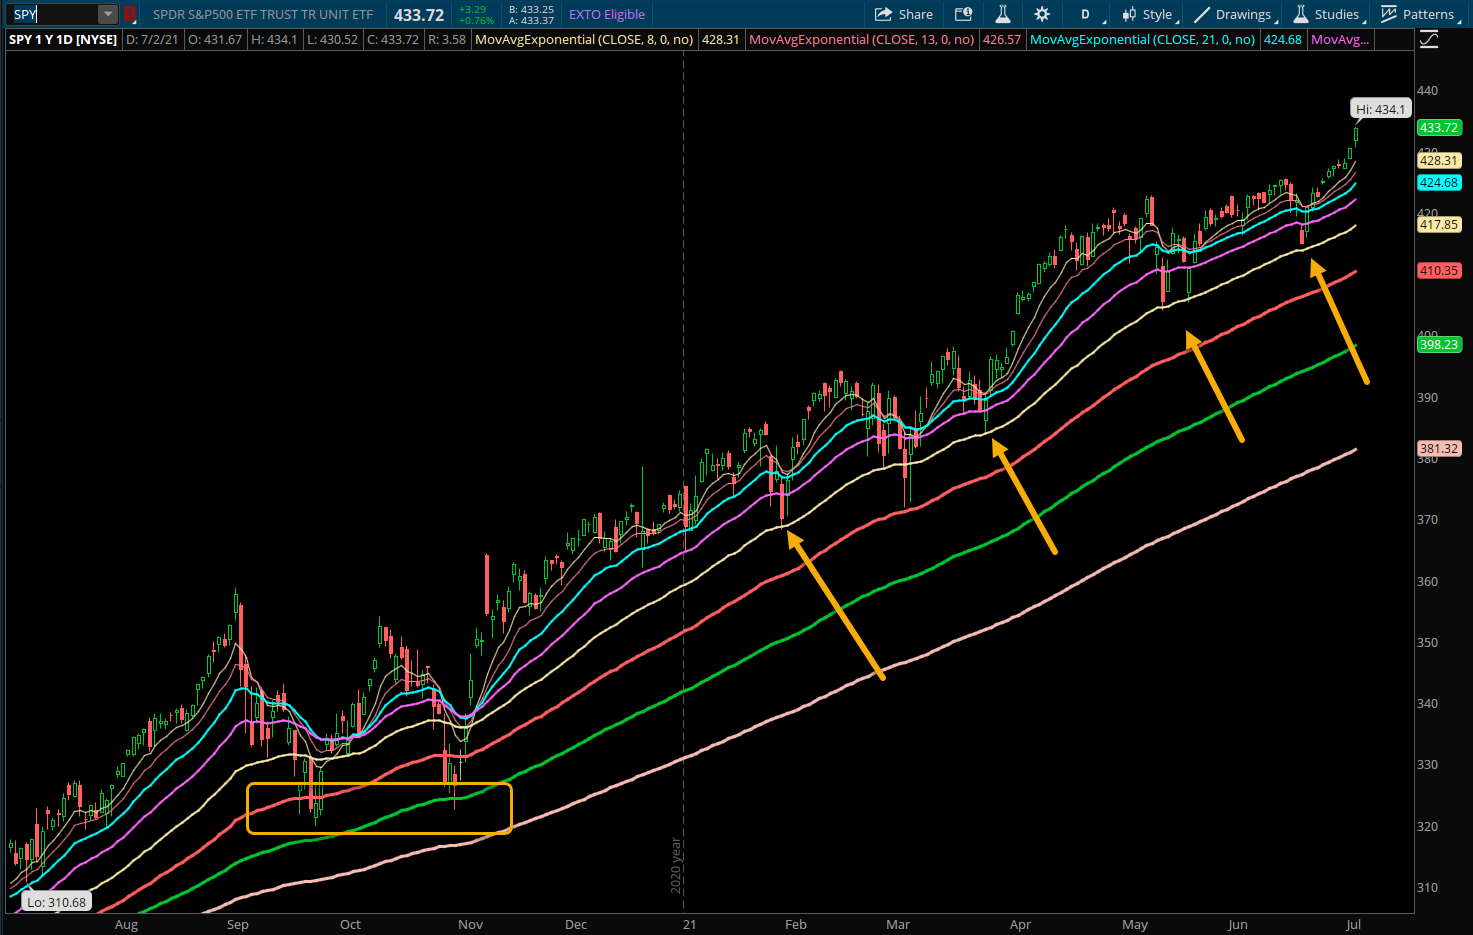
I often use the 8 and 21 EMA’s as they are a good judge of short term trends in markets and represent the start of the fibonacci numbers sequence. The sequence adds each previous number together to create the next. So starting at 8 the set of fibonacci numbers would be 8, 13, 21, 34, 55, 89, 144, 233 and so on into perpetuity. As traders we can see the 55 EMA is close to the 50 day that many use and the 233 EMA is close to the 200 day. Using these slightly altered settings can separate your trading from the crowd and perhaps help you see what the masses aren’t seeing. On the chart below of SPY, I have all of these fibonacci based exponential moving averages from 8 all the way to 233 displayed and it shows a stacked effect when trend is established in one direction. When you get this positive stacked look indicating each successive moving average above the previous you know that trend is strong.
Finding Setups
One way to utilize stacked moving averages is to identify trends and establish levels that would be attractive entry points on pullbacks depending on your timeframe. As a short term trader you may look for a dip to the 21 EMA or even the 34 EMA and either have a limit order set to buy shares or have an alert set to be aware of when to look at options to trade at that price level. I have noticed plenty of occurrences where the 21 EMA is violated for a few days only to test that 34 EMA and recover strongly thereafter. This is where having a trade plan comes in and knowing how much “heat” you are willing to take. During strong trends the 8 and 21 EMA should hold but often on more prolonged pullbacks we see the 55 EMA tested as shown above by the arrows 4 times in the SPY this year. If you are more of an intermediate to longer term trader, looking for pullbacks to the 89 EMA can offer great multi month trade entry points. An example of this is shown in the rectangle from late last year as the SPY found support at the green line (89 EMA).
Using Triggers for Entry
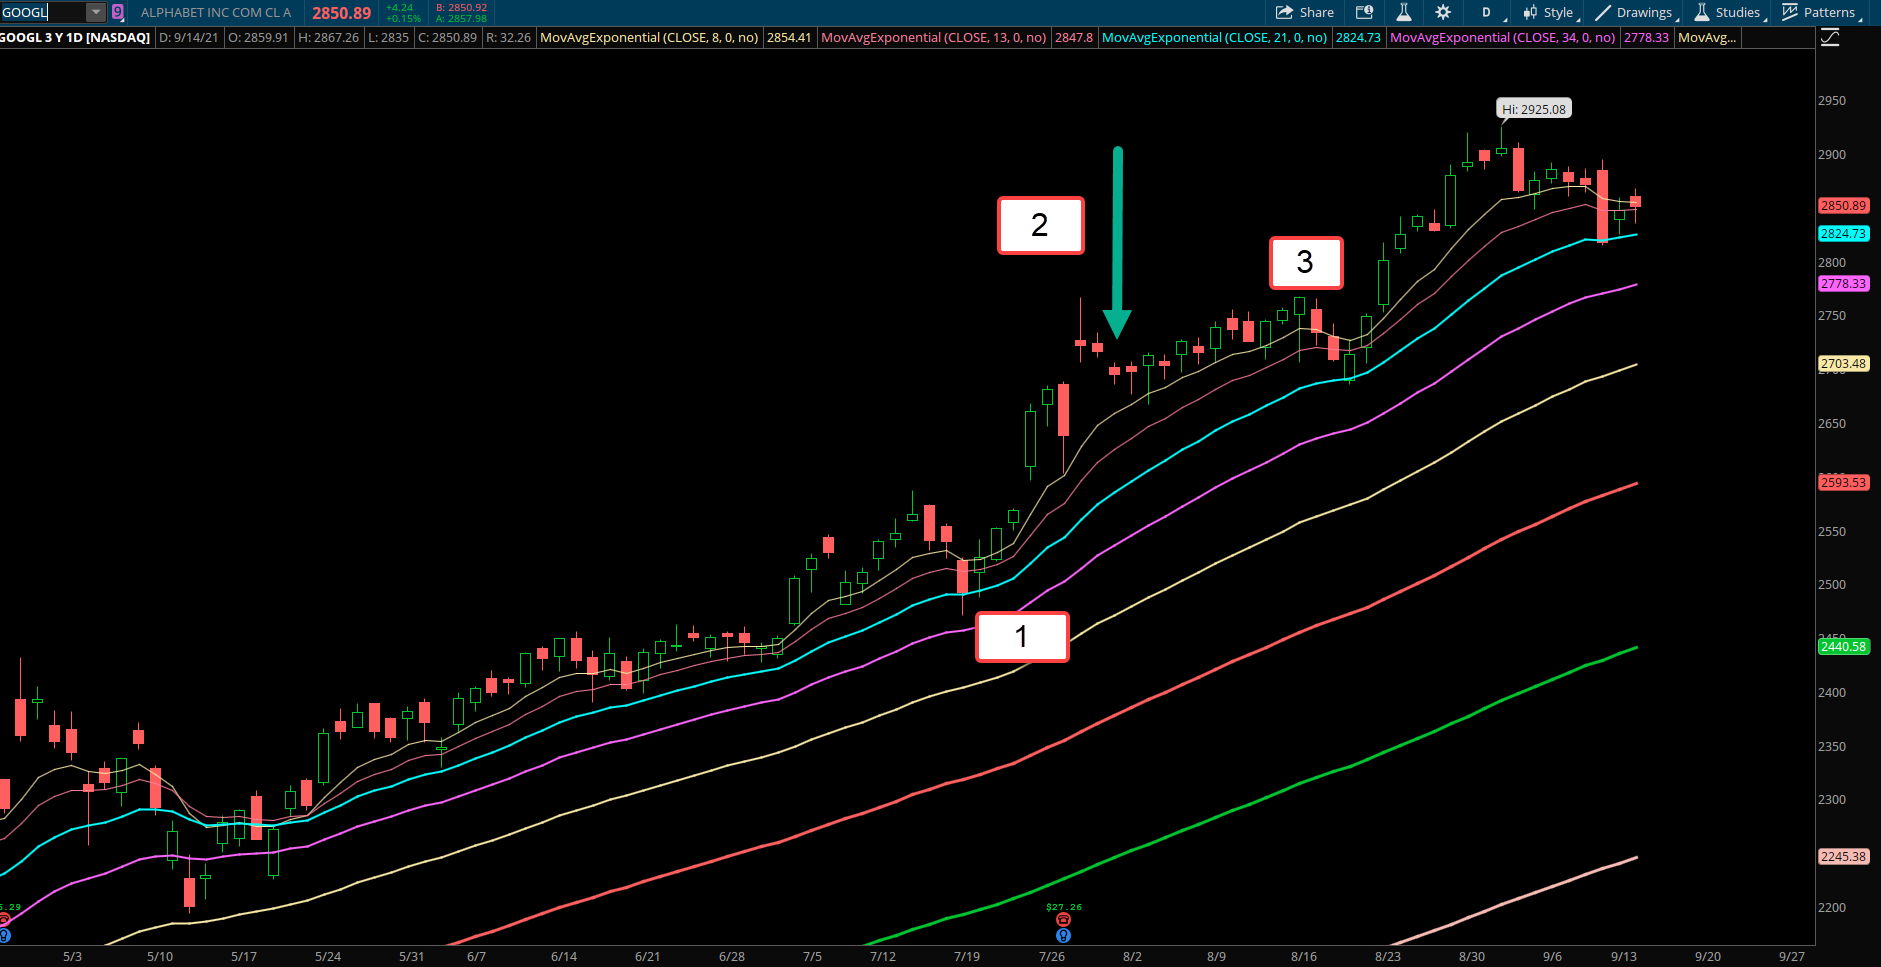
Another way to enter a trend using stacked EMA’s is wait for the pullback and then look for a trigger point to enter. This can be as simple as looking for a close back above that moving average as it was tested or using a close above the high of the low bar during the pullback. As shown below in the GOOGL chart the stacked moving averages show a strong trend in place. Looking for a dip to the 21 EMA at the first arrow was a nice way to get long, but if you preferred to wait for confirmation via a trigger, the next candle closed above the high of the low candle, and also regained the 8 EMA. Two triggers that would have been good to buy and look for the trend to resume. The second arrow shows another clear example of GOOGL testing the 21 EMA (blue line) in August 2021 and then the next day clearing the high to close back above the 8 EMA.

Exit Plan for Managing Risk
Once you are in a trade that you established within a strong trend the hardest part can always be knowing when to exit. Anyone can enter but money is made on the exit. Keeping it simple is always best but it often depends how directional your trade is and whether you traded a short duration expiration for options or not. Assuming that is not an issue then letting a trade work as long as it’s above the 8 EMA is a good rule of thumb. If we entered long GOOGL at point 1 in the chart below, the stock did not close below the 8 EMA until point 3. Sometimes waiting for this rule can give back some gains from the highs so if preferred then using a close below the prior two candles is also an alternate valid exit signal. In this example, point 2 and the arrow shows the day when the stock closed below the low of the prior two candles. Either one of these exit strategies allows for the trend to tell us when things may be shifting and helps avoid overthinking and bias.
Takeaways
- Using stacked EMA’s to establish trend strength can help determine what your directional bias and aggressiveness should be when looking to open a trade. If the key moving averages are not stacked and sloping in one direction, then the market is likely choppy and neutral.
- As a shorter term trader, seeing the big picture trend is very powerful in getting a visual of who is in charge as trends last much longer than anyone can imagine and that should give you confidence in taking the trade.
- Using stacked moving averages to see trends, and find entry and exit points while managing risk on active trades can make trading much simpler.
- These are all just general ideas that can be used on any timeframe but if focused on trading the trend it’s important to have filters to make decision making easier. Using a 50 day vs. a 55 EMA doesn’t make a huge difference but staying consistent and systematic helps.