VIX Rubber Band Reversion Setup
There are a lot of ways traders interpret the markets and the volatility that surrounds them, especially in bear markets like we have seen this year. The simplest way to gauge market volatility is with the VIX index. As a quick review the VIX is the measurement of implied volatility of options on the SPX (S&P 500). When volatility increases it becomes important to watch the VIX and how it inversely correlates to stock prices. There are also the /VX futures which are tradable and have several different futures months that show the markets relative fear or complacency. I’ve written in prior posts on more detailed ways to use VIX as a tool in your trading but what’s the best way to understand where the VIX is relative to what is normal?
I believe volatility markets revert to their historical average much more than stock prices and that is pretty evident by just looking at a chart of the VIX. Instead of trending smoothly like a stock might, volatility usually spikes suddenly and then collapses and bleeds lower for a while. The mean reversion of asset volatility is more likely than remaining constant. The VIX also tends to cluster once it does make a more drastic change in behavior. Volatility clustering refers to the fact that large changes tend to be followed by large changes and small changes tend to be followed by small changes. So knowing this, how do you best take advantage of volatility reversion? One way I have traded this is the rubber band setup on VIX using bollinger bands.
Rubber Band Reversion Setup
Looking at the VIX daily chart below shows a set of bollinger bands set to the default settings of 20 simple period moving average in blue and the purple lines being +2 and -2 standard deviations above/below the moving average. You can see most of the time the VIX is doing a lot of nothing on a daily chart and largely is contained inside of the bollinger band. But when it closes above its upper bollinger band line it tends to not stay up there too long. This is the rubber band effect of volatility being mean reverting and the snapback of the rubber band tends to be fast and oftentimes violent.
I like to add a Disparity Index study which is available on most charting platforms and shows how much in percentage terms above or below a moving average the price is. So for example using a 20 period Disparity Index like below will tell us how much % the VIX is above the 20 day MA. I also marked a horizontal line at 20 clearly showing me when the VIX is 20% above its 20 day simple moving average. Now we have two angles to let us know a meaningful distance away from its mean, or average. The bollinger bands and the disparity index.
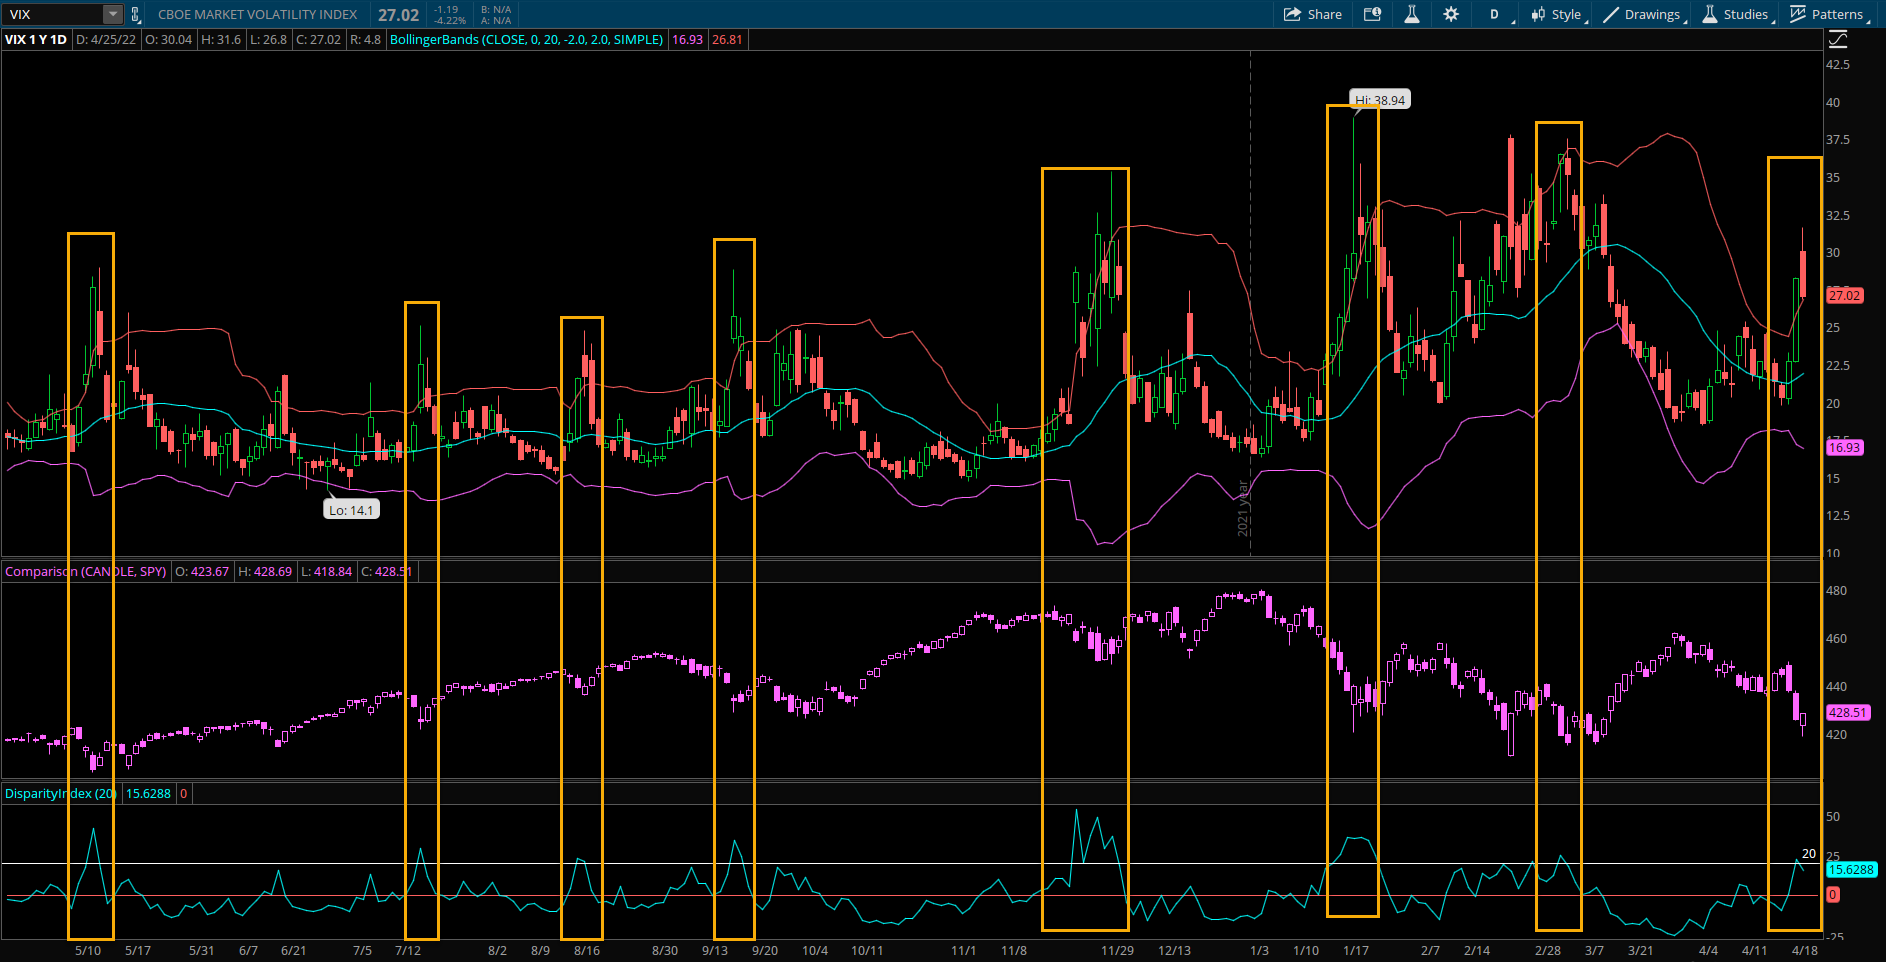
You can see just in the past year there have been 8 different occurrences of the VIX being stretched above a statistically significant level where the daily candle CLOSED above the upper bollinger band AND also was at least 20% above its 20 day MA. There is nothing specific about 20% above the 20 day MA but I just noticed it matches up well to start looking for reversion. But using 30% above likely works even better and avoids a few early entries in times where the VIX continues up a day or two further.
Rubber Band Reversion Trade Parameters
- Wait for the VIX to close above its upper bollinger band. If the disparity index also shows it being at least 20% above its 20 day MA then the criteria is met.
- Buy SPY at the close when these criteria are met. You can do this right before the close, in the 15 minutes after the close since SPY options still trade until 4:15 pm EST. Or if you prefer you can wait for the confirmation the next day and buy at the open. You sometimes can get better prices with a gap down the following trading day after the VIX meets these criteria and then it sets up a buy the panic open type of trade.
- There are several ways I like to play this setup. You can either sell puts to open, or sell put credit spreads. Since we are usually fading a high IV market its best to avoid out of the money call buys but you can buy at the money calls with at least 30 days till expiration. Or for advanced traders you can even buy a ratio backspread for a small debit or even credit, which almost eliminates downside risk if the market continues to tank.
- Hold the long SPY trade for between 2-20 days depending on the way price action responds. Often it can take a day or two to get the reversal going but by day 5 there is a strong positive return associated with the setup as shown in the results table below. Ideally you can target the SPY to hit its 20 day moving average on a reversion to the mean but scaling out is appropriate as well since this is technically a counter trend trade.
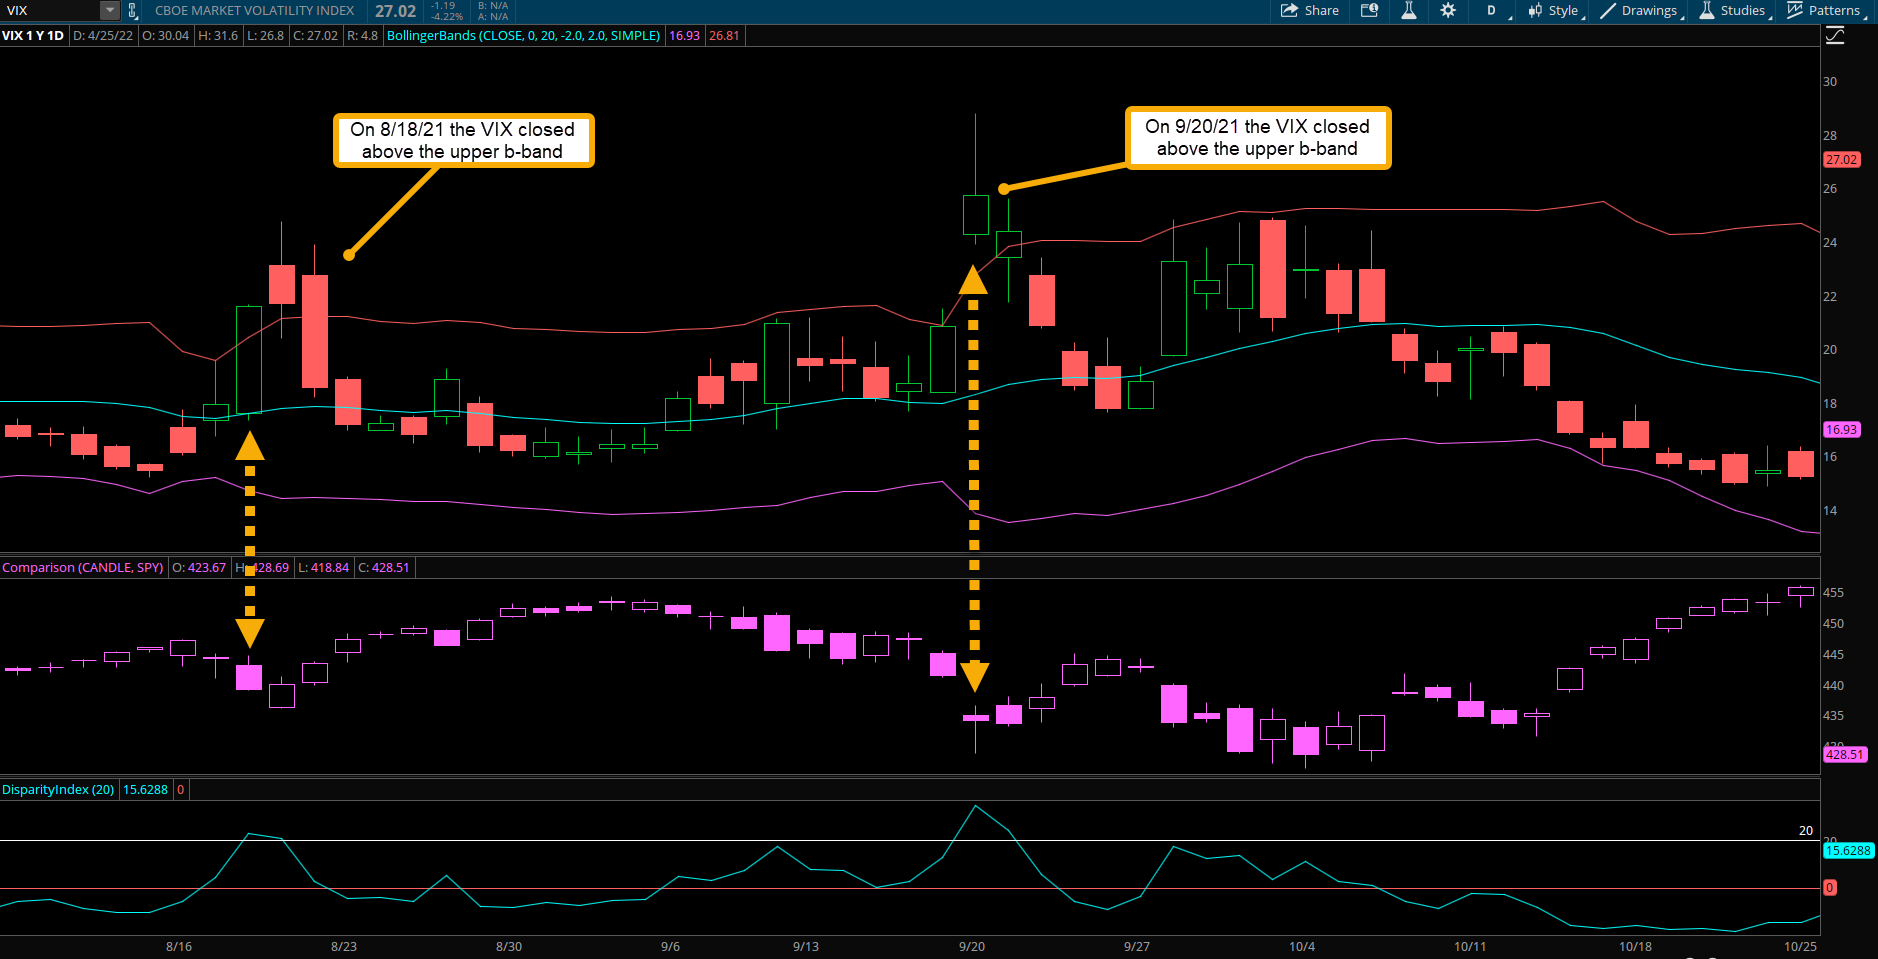
The example below from late Summer 2021 shows the VIX closed above its bollinger bands on August 18th and also a month later on September 20th. In the first trade on 8/18 the SPY closed that day at 439.18. The next day the market gapped down into 436 before reversing higher and closing green. Five days later the SPY closed at near 449. During those days the VIX reverted all the way back to its 20 day MA and lower falling over 25% as the rubber band got too stretched. The example a month later was almost identical. The VIX gapped up to 25 as the SPY closed down at 434 registering the rubber band snapback setup. Within days the gap down in SPY was filled as prices raced back higher and on day 5 the SPY was back at 444. A solid one week reversion to the mean trade.
Recent Occurrences and Forward Returns
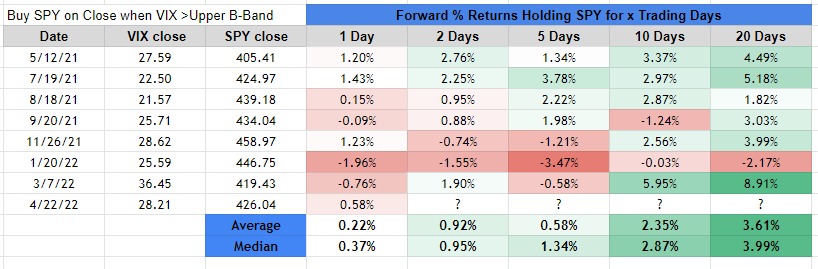
Depending on volatility in markets you might have 1-2 of these setups per year in a tame stable market like 2017 or sometimes 6-10 of them in more wild markets. I mentioned that in the last year there have been 8 of these occurrences where the parameters of this setup were met. So how did it shake out? The table below shows each time the criteria was met followed by the % returns of holding SPY long from between 1 days to 20 days. It clearly shows a bullish bias but especially further out between 10-20 days after the setup meets its criteria.
The most recent occurrence just happened last Friday so it will take some time to see what its returns turn out to be but the previous 7 times in the last year have shown a upside bias 20 days out with 6 of 7 times positive for an average return of +3.61% and a median return just about +4%. The only time in the past year this setup has not shown a positive 20 day return is in the January 2022 example and even then it was only down -2.17% after 20 days. Interestingly enough I was curious to see what this Jan 2022 trade looked like after 50 trading days and the return was positive at +1.38% after the large March 2022 market rebound. 5 of 7 occurrences had positive returns 2 days after with average gains near 1%. 10 days out on average has a return of +2.35% with hardly a drawdown beyond that amount.
Every single occurrence except for the January 2022 setup showed a positive return at some point between 2 and 20 days out. I can make an argument that the January 2022 selloff in markets and subsequent VIX surge was the beginning of a new bear market in stocks and thus the volatility regime shift we often see at the start of a new cycle of volatility was too strong to fade. So in this case there was eventually a large reversion to the mean but it began a few days after the VIX criteria was met so instead of the SPY bottoming near January 20th it actually did not until 2 trading days later which put a dent in the returns since VIX continued to close above its upper bollinger band for 4 straight days. Perhaps also throwing on a simple filter like using key support or resistance lining up with the trade entry can avoid a few occurrences that had an early entry before support levels were met. Another potential solution in more volatile markets (VIX above 30) would be to scale into this trade, buying half a SPY position on the first VIX close above the band and then buying the second half if it continues to move that direction.
These results are just a small sample size in the last year but show a good variety of VIX ranges for each trade setup example, from a low near 21 to a high over 36. I’ve been following this setup for years and would feel confident saying these returns are likely similarly consistent over multiple years as well.
Risks to Volatility Mean Reversion in Outlier Events
Now it’s important to note that VIX spikes in a stock bull market are much more likely to quickly fade lower and revert compared to those volatility spikes during a bear market that often can persist for weeks even. Or sometimes large shifts in fundamental macro news can have long lasting shifts in volatility regimes where the floor of the VIX is no longer 12-15 but instead moves to 20-30.
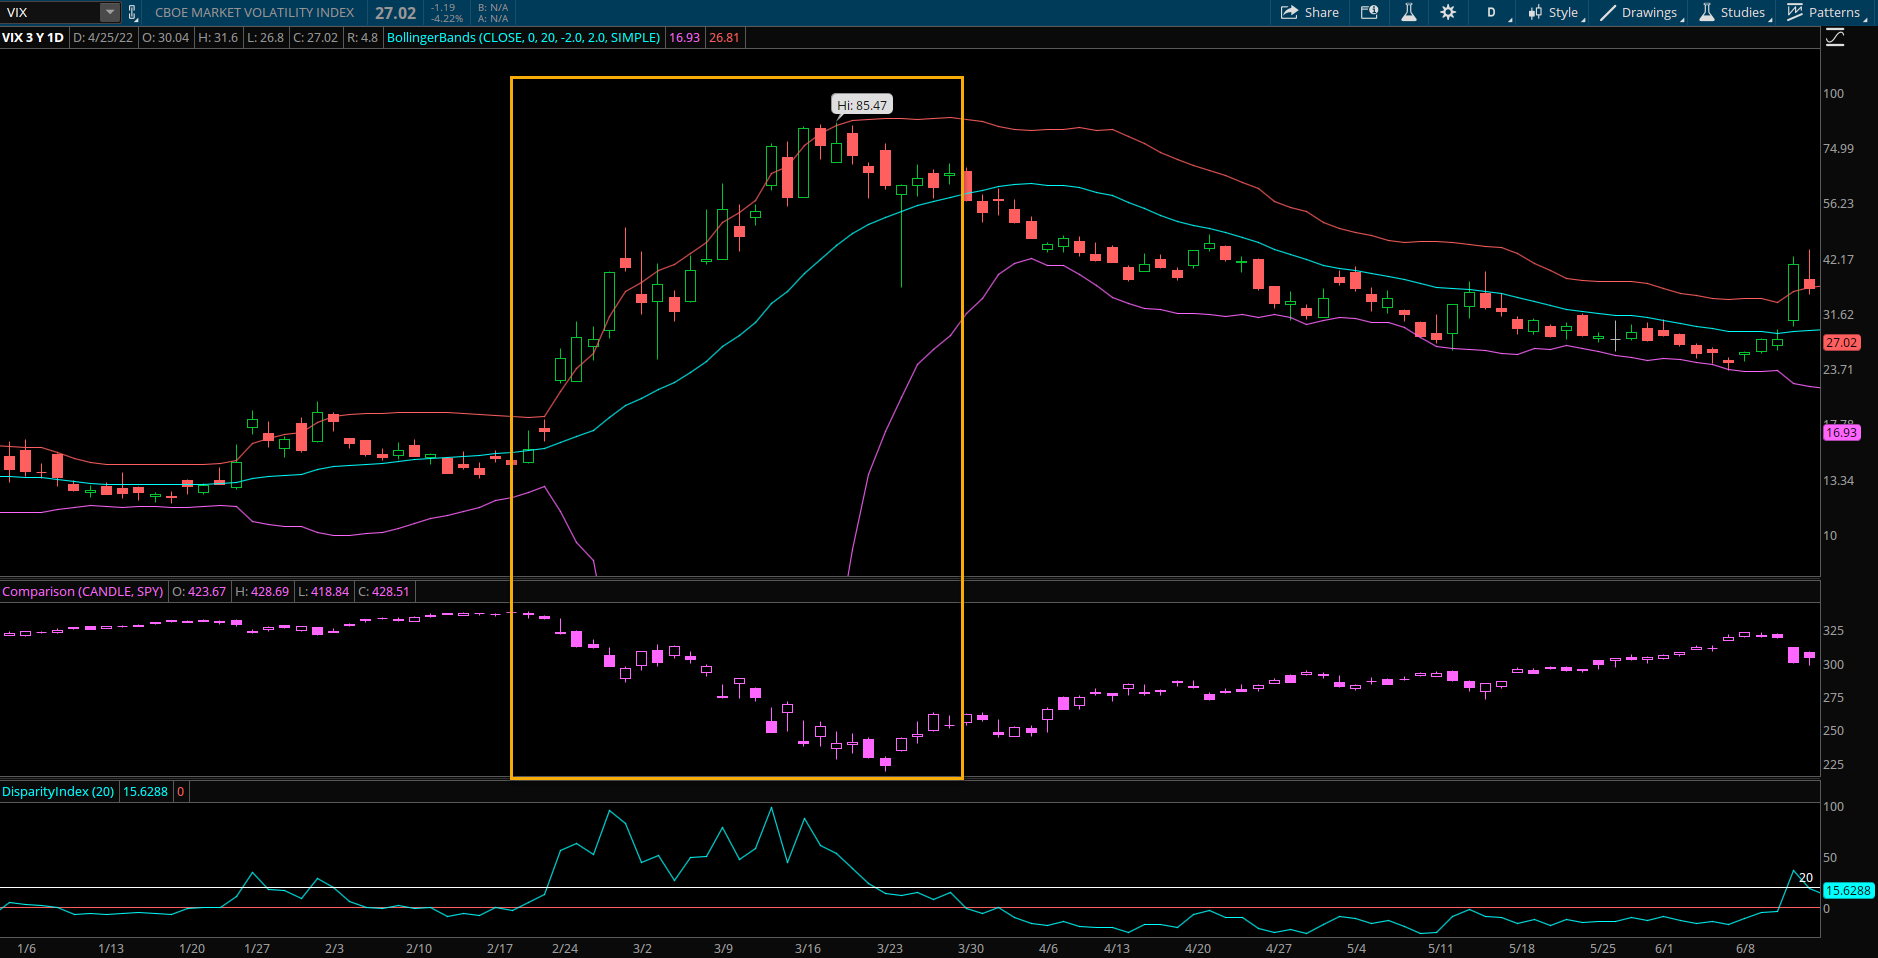
The COVID crash is a prime example as VIX closed above the upper bollinger band for 5 straight days once it got above it initially. Then after about 3-4 days of pulling back it surged right back up riding its upper bollinger for most of March 2020. This clearly was an outlier event but an example of how a major shift in the volatility regime can create a new floor at much higher levels for months or sometimes years to come. Naturally the higher the VIX is then the higher the volatility and average true ranges are in the markets. So it makes sense to be aware of the big picture trend of the markets and key risk factors driving that actual volatility. Markets move fast but very often using the VIX and the rubber band setup can identify key inflection points in the markets where mean reversion is highly likely. These examples I have shown focus on the immediate next 20 days of returns since that is the window of trading timeframe I have mostly used when trading this but there are several examples over the years that marked longer term bottoms in the markets using this oversold setup.
Takeaways:
- The VIX rubber band reversion setup uses bollinger bands and the disparity index.
- Buying SPY when VIX closed above its upper bollinger band and is at least 20% above its 20 day MA results in a positive return expectancy.
- Volatility markets have a tendency to exhibit mean reversion.
- When the VIX closes above a stretched level like the upper bollinger band it often is an intermediate term turning point in markets as bearish sentiment flushes out.
- Every single occurrence except for the January 2022 setup showed a positive return at some point between 2 and 20 days out.