Weekly Market View 1-16-2023
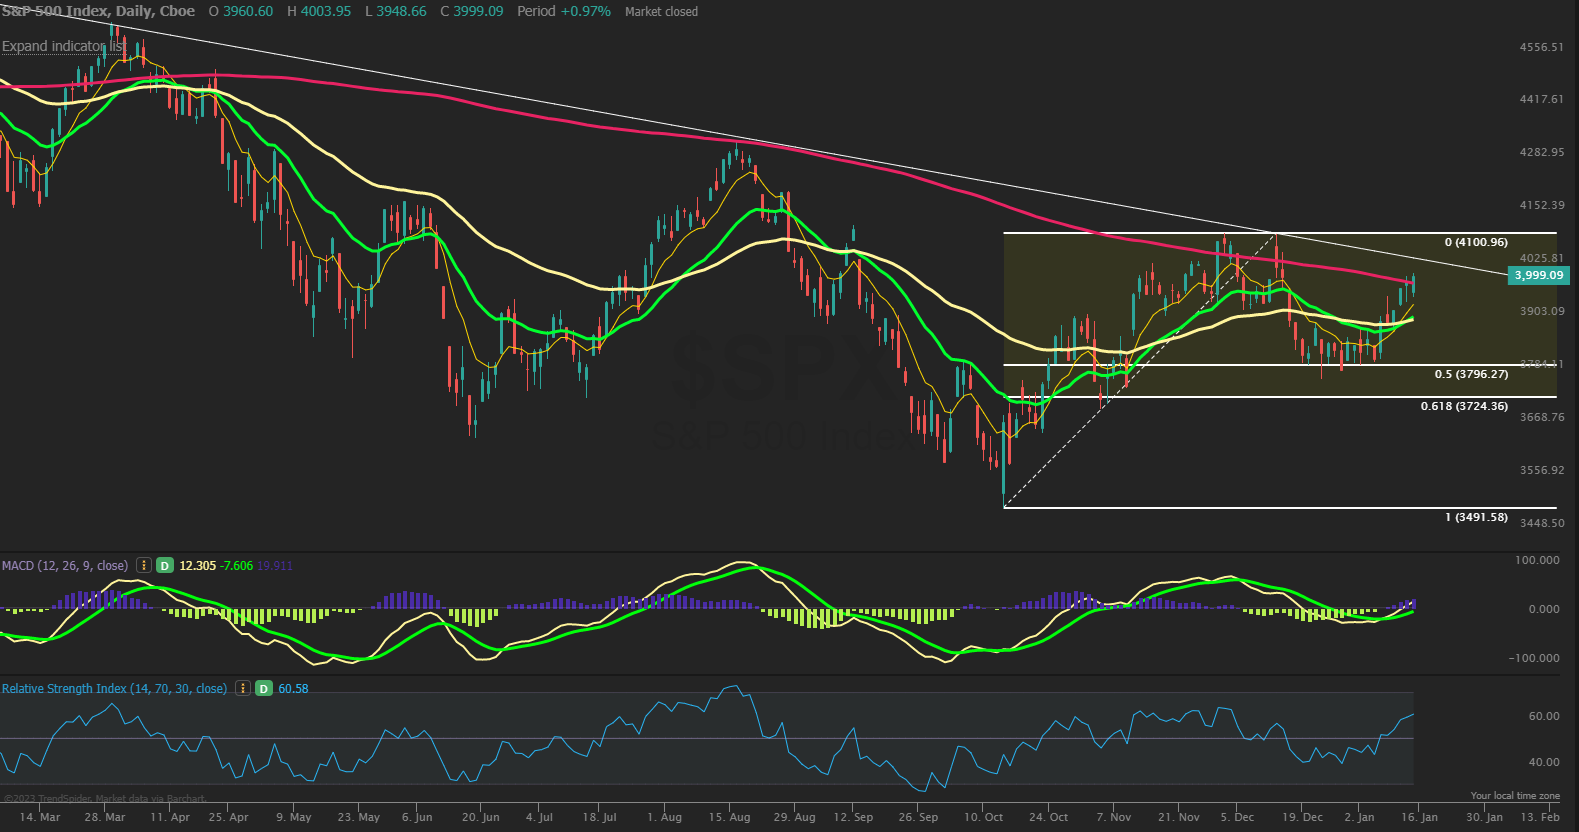
The SPX closed the week strong back above the 200-day MA just slightly and right at the 4000 round number target we had been looking for to start the year now as MACD crossed bullish and several breadth signals flashing buy mode. Prices held above the 8/21 EMA’s all week and dips have been bought with the SPX now nearing a break above the 200 MA and the trendline from the 2022 highs just above here at 4025 roughly. Support is seen below at the 8 EMA near 3935 and the 21 EMA at 3905 while next resistance is 4025 and 4050 with the December highs right at 4100. The 50% retracement held strong support recently at 3800 so likely to see a retest of that December high from here or some chop and consolidation is possible into a large January OPEX this week. RSI strong and hitting the 60 level now in bull mode.
AAII sentiment for the week ending 1/11 showed bullish responses rise to 24.0% from 20.5% prior while bearish responses fell to 39.9% from 42.0%. Neutral sentiment fell to 36.0% from 37.5%. Pessimism among individual investors about the short-term direction of the stock market fell to its lowest level in 10 weeks. Neutral sentiment also pulled back, while optimism rebounded. NAAIM Exposure index increased to 45.31 from 38.79 and is below last quarters average of 51.03. Lipper fund flows for the week ending 1/11 had $1.2B of outflows in equities. Friday’s close saw NYSE new highs at 104 while new lows of 6 and the 10-day MA of New High/Low Differential is positive now at +55. The percentage of SPX stocks above their 50-MA is 77% while those above their 200-MA was 66.2%. NYSI and NASI Summation indexes have crossed above the 8-MA for a short-term bullish signal. NYMO McClellan Oscillator closed at +96 and is now short term overbought. Cumulative AD line had a strong surge above the 40 EMA and above the 89 EMA long term signal. CBOE Equity P/C 50-day MA at 0.89 and at new highs based primarily on put arb trades skewing the data. CNN Fear and Greed index is in Greed zone at 63 from 47 last week.