Weekly Market View 1-23-2023
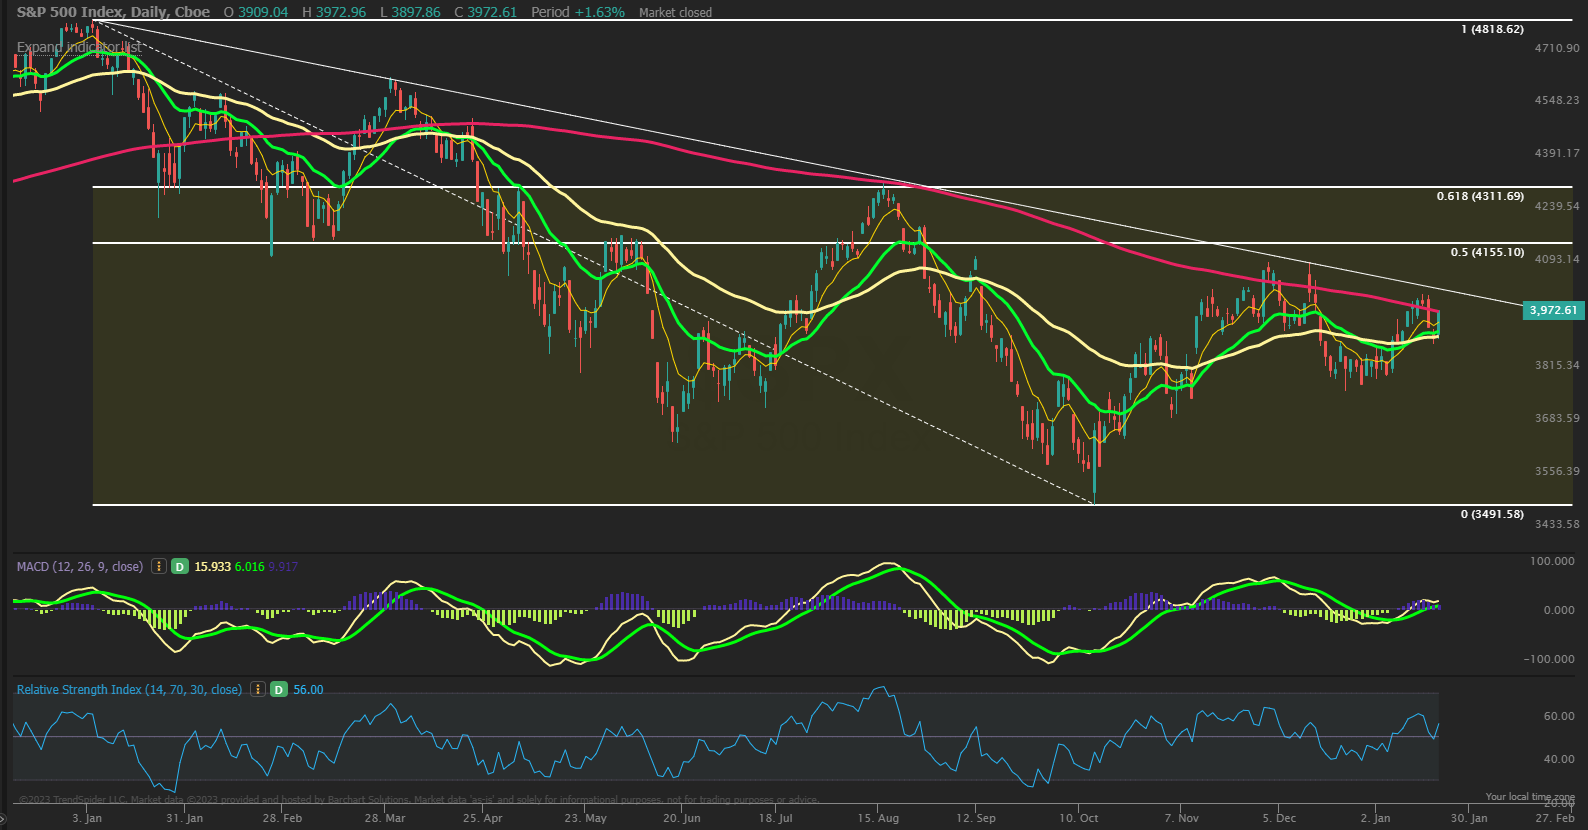
The SPX had a mixed week but overall finishing slightly lower even with the Friday rebound rally closing strong right back at the 200 day MA near 3975. There may have been some OPEX flows pushing prices higher Friday so the start of this week should be interesting to see if can see price close back over the 200 MA and make a higher high above the trendline from the highs which could be a pivotal trend shift longer term and point to a stronger rally up to the 50% retrace at 4155 and even maybe the 61.8% fib retrace up at 4311. But earnings season is here and that brings a wildcard factor along with the coming next FOMC meeting on 2/1 likely being a big inflection date for momentum. The MACD and RSI are still in bull mode and breadth continues to impress and suggest bulls are in control. Support is seen at 3915 below and then 3875 while a drop below that likely retests 3800. Closing January above 3840 would ensure a positive month to start 2023 and that is looked at as a key barometer for the year ahead.
Market Sentiment/Breadth
AAII sentiment for the week ending 1/18 showed bullish responses rise to 31.0% from 24.0% prior while bearish responses fell to 33.1% from 39.9%. Neutral sentiment was unchanged at 36.0% from 36.0%. Optimism among individual investors about the short-term direction of the stock market rose to its highest level in nine weeks. Neutral sentiment remained the same, while pessimism fell to its lowest level in 11 weeks. NAAIM Exposure index increased to 65.07 from 45.31 and is now above last quarters average of 51.03. Lipper fund flows for the week ending 1/18 had $4.1B of outflows in equities. Friday’s close saw NYSE new highs at 47 while new lows of 16 and the 10-day MA of New High/Low Differential is positive at +73. The percentage of SPX stocks above their 50-MA is 62.8% while those above their 200-MA was 62.2%. NYSI and NASI Summation indexes are above the 8-MA for a short-term bullish signal. NYMO McClellan Oscillator closed at +56 and is now back near the neutral zone. Cumulative AD line had a strong surge above the 40 EMA and above the 89 EMA long term bull signal. CBOE Equity P/C 50-day MA at 0.89 and at new highs based primarily on put arb trades skewing the data. CNN Fear and Greed index is in Greed zone at 59 from 64 last week.