Weekly Market View 11-20-22
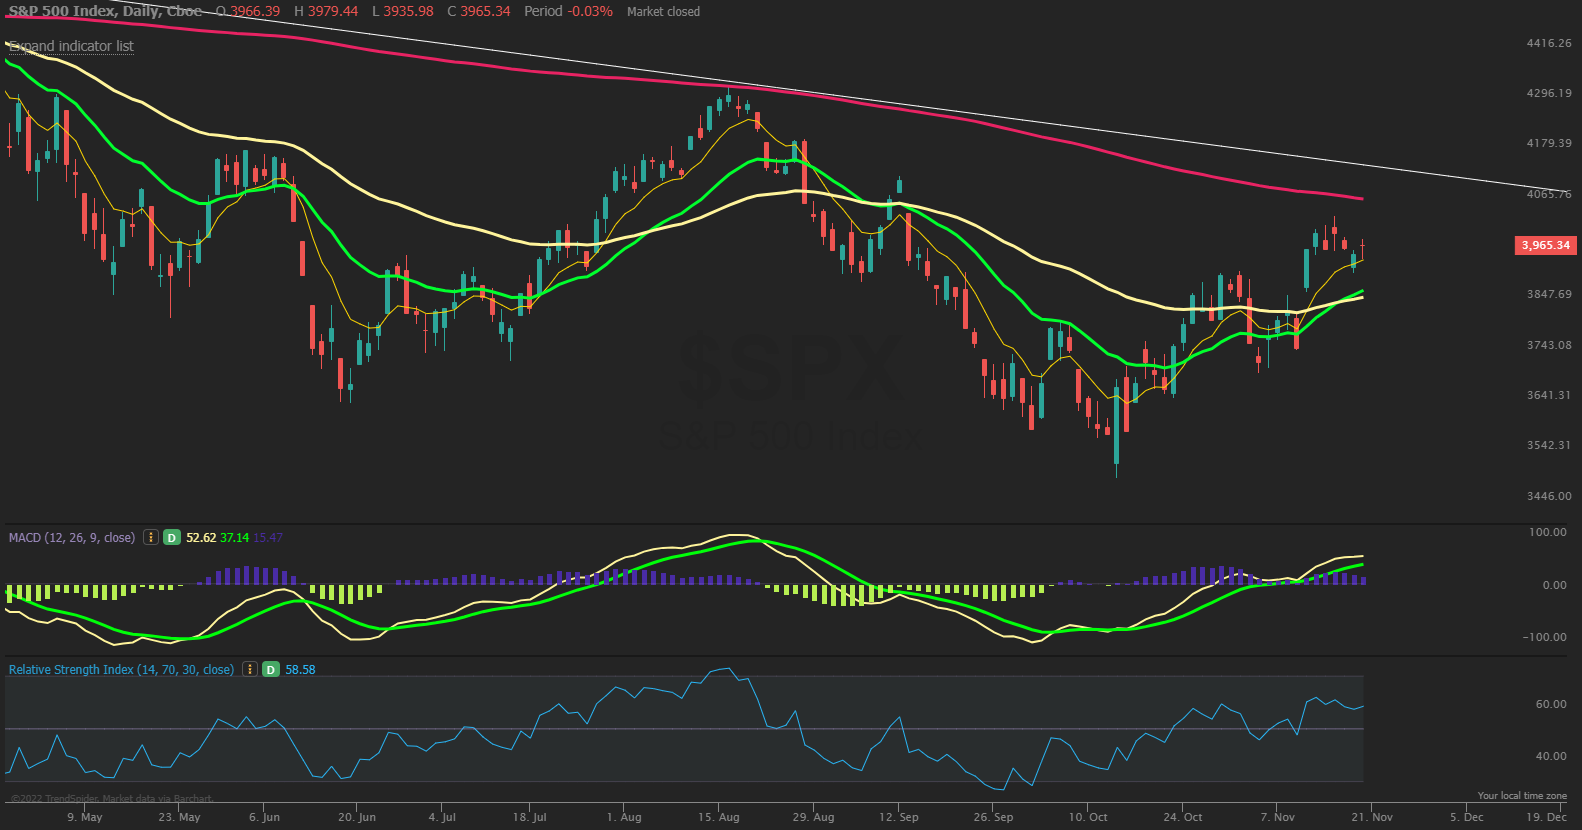
The SPX had a quiet week consolidating the sharp recent rally and staying above the 8 EMA after testing it Thursday and bouncing to close the week at 3965 and just under the large 4000 level that provid75 ed resistance during OPEX week. With expiration passing there could be a further lower test of the rising 21 EMA currently at 3875 if weakness was seen during the holiday week upcoming. The market is still in bullish mode based on MACD and RSI along with breadth signals and the recent pause is forming a potential bull flag with upside into the 200-day MA near 4060. Above that, the YTD VWAP is also near the 4080 level and a trendline from the highs comes in near 4100. A pullback lower would see first support at 3875 but below that a volume pocket opens down to 3750 where prices were before the strong CPI Day rally.
Market Sentiment/Breadth
AAII sentiment for the week ending 11/16 showed bullish responses rise to 33.5% from 25.1% prior while bearish responses fell to 40.2% from 47.0%. Neutral sentiment fell to 26.3% from 27.9%. Pessimism pulled back following last week’s big jump, and neutral sentiment declined. Optimism was last higher on December 30, 2021 (37.7%). Even with the big increase, bullish sentiment remains below its historical average of 37.5% for the 46th consecutive week. NAAIM Exposure index increased to 64.96 from 53.33 and is above last quarters average of 40.63. Lipper fund flows for the week ending 11/14 had $14.6B of inflows in equities. Friday’s close saw NYSE new highs at 70 while new lows of 42 and the 10-day MA of New High/Low Differential is at -9 but nearing a positive cross for the first time since August. The percentage of SPX stocks above their 50-MA is 83% while those above their 200-MA was 56.2%. NYSI and NASI Summation indexes are positive above 8-MA for a short-term bullish signal. NYMO McClellan Oscillator closed at 24.1 and is slightly overbought short term. Cumulative AD line has crossed above the 40 EMA while is nearing a bullish cross above the 89 EMA long term signal. CBOE Equity P/C 50-day MA at 0.74 and still at 2-year highs showing high pessimism. CNN Fear and Greed index is in Greed zone at 62 from 65 last week.