Weekly Market View 2-13-2023
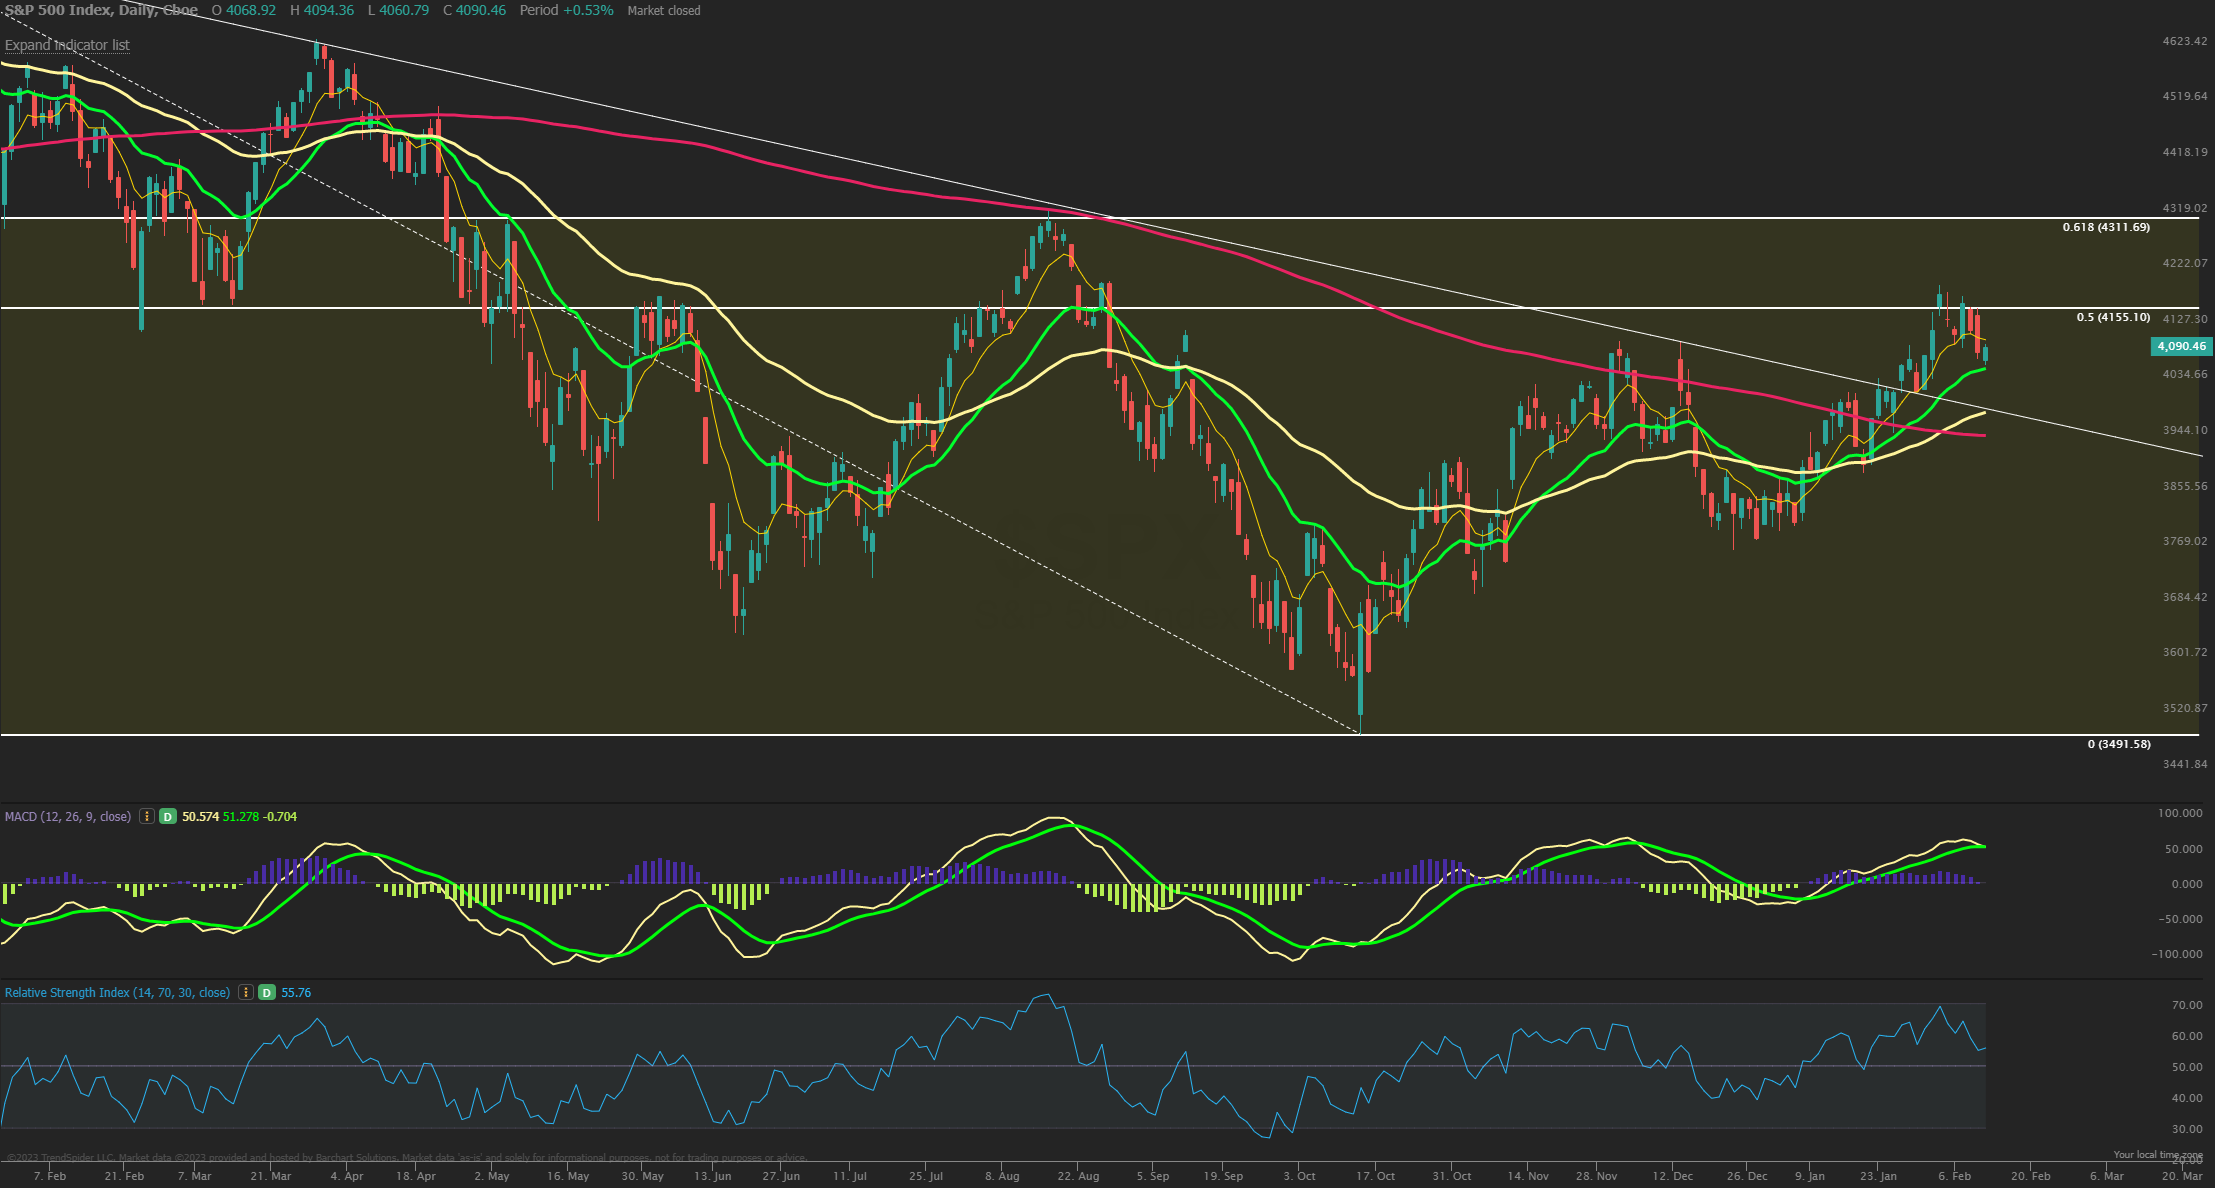
The SPX pulled back this week off the 4200 stiff resistance level reached into FOMC day and the 50% retracement at 4155 from the entire bear market decline. The pullback is healthy at this point holding a test of the 21 EMA on Friday and near the top of monthly value are also near 4060. But with other markets flashing signals like bonds and the dollar and the VIX rising the past week it could point to a larger dip coming from this strong early 2023 rally. Support on a larger level comes in closer to the 4000 round number SPX level and that is also coinciding with a retest of the 55 day MA and near the back test of the trendline from all time highs so coming back to touch that support would be normal at this point. MACD is crossing bearish on Friday also giving sell signals based on momentum while RSI is still maintaining above the 50-midpoint zone. A 50% retracement from the October lows to recent lows would be at 3844.
Market Sentiment/Breadth
AAII sentiment for the week ending 2/8 showed bullish responses rise to 37.5% from 29.9% prior while bearish responses fell to 25.0% from 34.6%. Neutral sentiment rose to 37.5% from 35.5%. This is the highest level of optimism registered by the survey since December 30, 2021 (37.7%). It is also the first time in 58 weeks that bullish sentiment is at or above its historical average of 37.5%. The bull-bear spread (bullish minus bearish sentiment) is 12.5%. This is the first positive reading in 45 weeks. NAAIM Exposure index increased to 85.40 from 78.37 and is at the highest levels since January 2022 and above last quarters average of 51.03. Lipper fund flows for the week ending 2/8 had $111M of inflows in equities. Friday’s close saw NYSE new highs at 42 while new lows of 15 and the 10-day MA of New High/Low Differential is positive at +93. The percentage of SPX stocks above their 50-MA is 65.6% while those above their 200-MA was 70.8%. NYSI and NASI Summation indexes are crossing below their 8-MA and confirmed a sell signal late this week. NYMO McClellan Oscillator closed at -43 and is now back closer to reaching a short term oversold level. Cumulative AD line pulled back this week but still above the 40 EMA short term trend and above the 89 EMA long term bull signal. CBOE Equity P/C 50-day MA at 0.83 and falling the past few weeks as put arb trades slow. CNN Fear and Greed index is in Greed zone at 70 from 76 last week.