Weekly Market View 3-5-2023
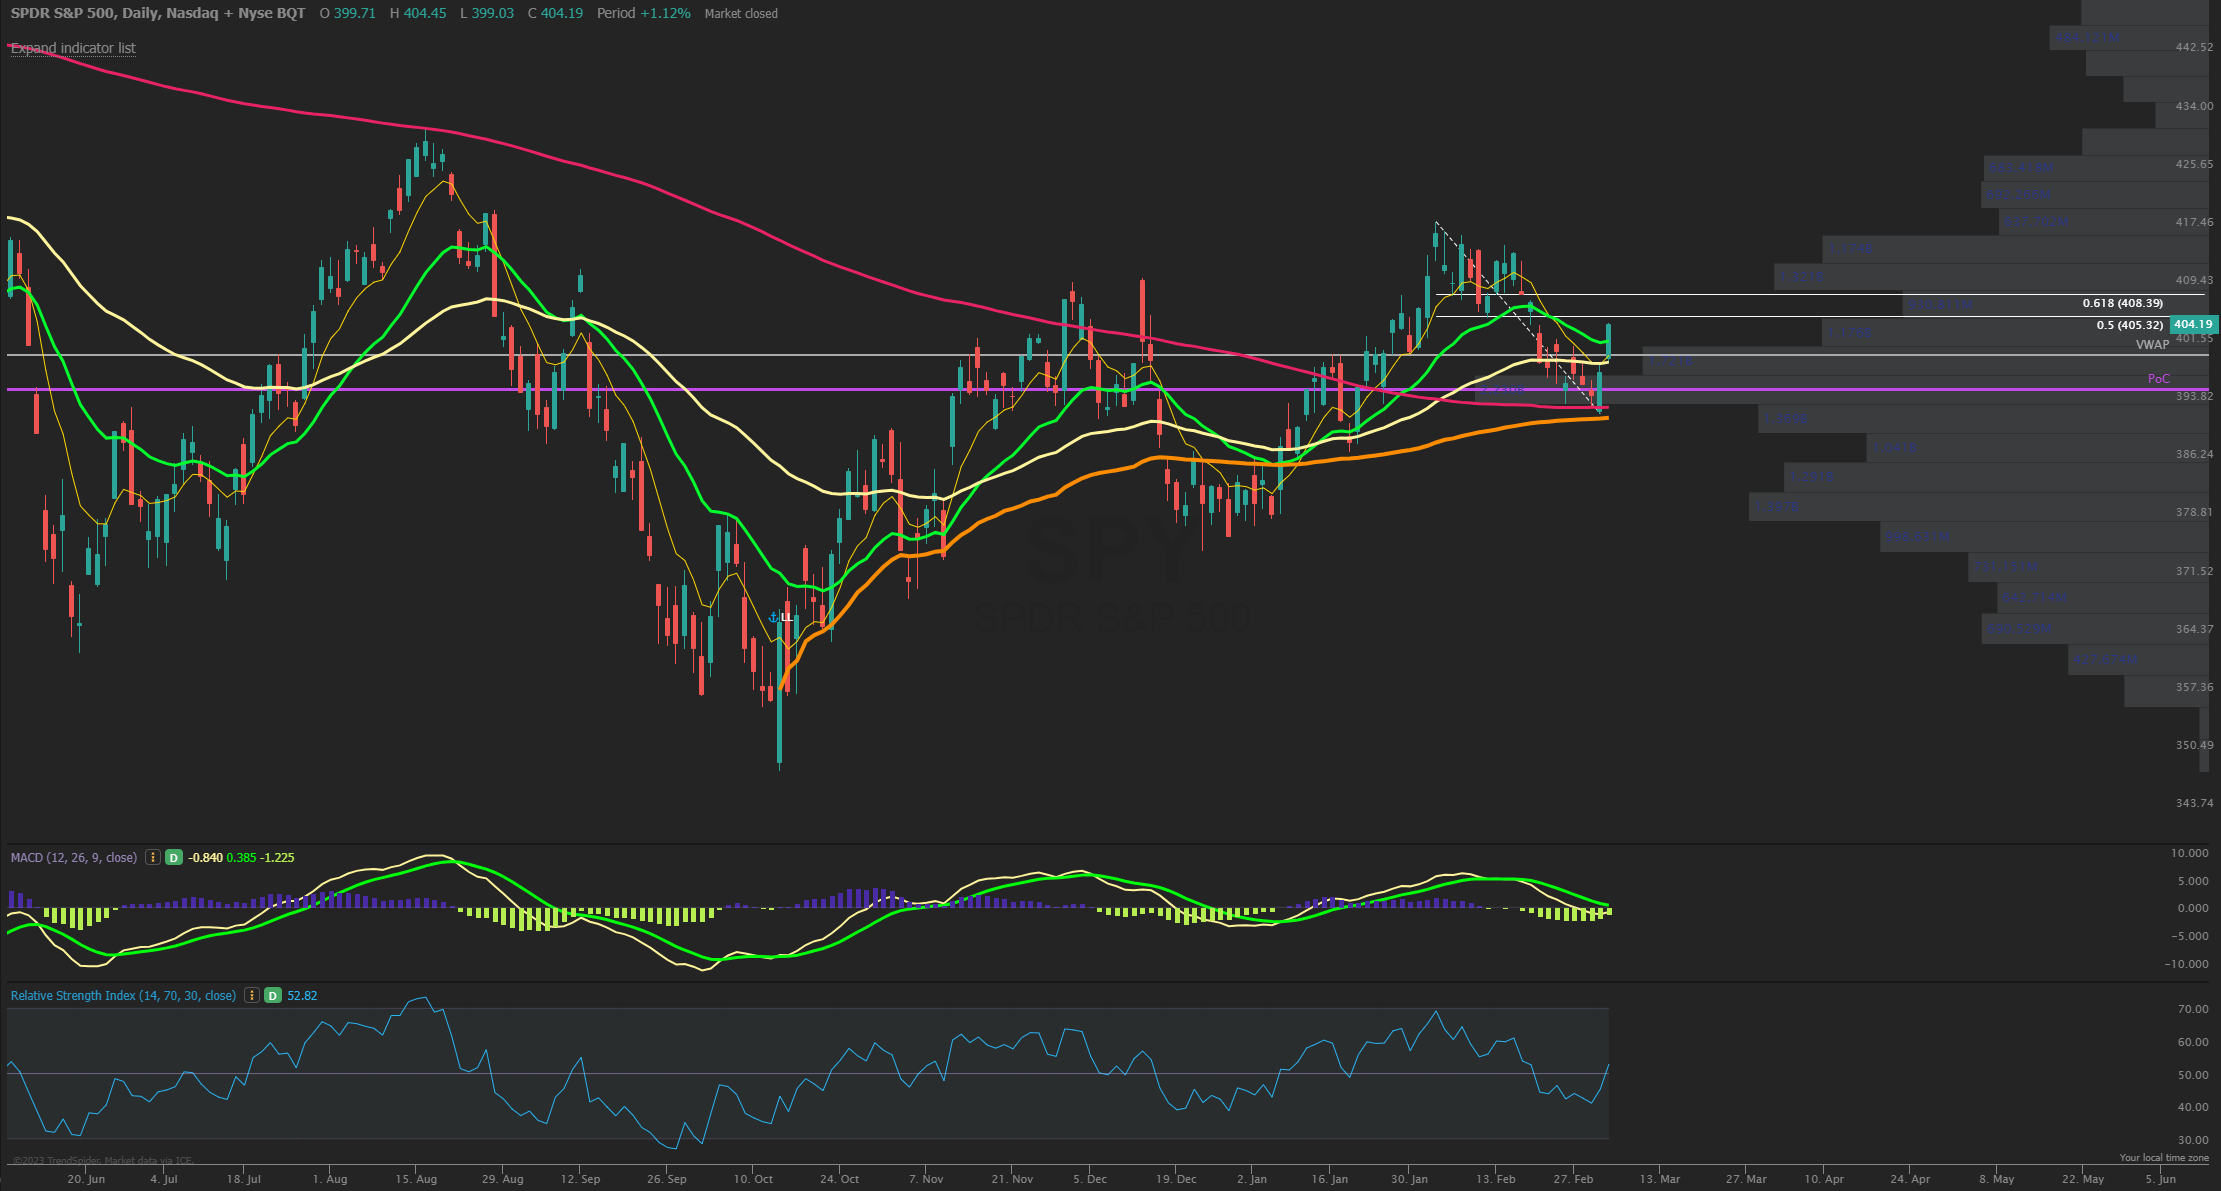
The SPX had a strong rebound to close the week after seeing a midweek low near 3925 which was the massive support we have been targeting as the confluence of the 200 day MA and anchored VWAP from the October lows as well as one year VPOC all down near the 393-395 SPY zone. The bounce got back over the 21 EMA slightly on the SPX which sits at 4027 and although still in a downtrend based on NYSI and the 8/21 EMA being in a bear cross still, the rebound can still get up to the 4075-4100 zone which is near a gap fill from the Pres day gap down and the 50% retrace of the recent decline and the former highs from December. Support is seen first at the 4000 level below and will be a key line in sand as it has been for awhile now. RSI got down near oversold short-term hitting a low of 40 and bounced back to the 50 level while MACD still in bear mode but curling higher slowly.
Market Sentiment/Breadth
AAII sentiment for the week ending 3/1 showed bullish responses rise slightly to 23.4% from 21.6% prior while bearish responses rose to 44.8% from 38.6%. Neutral sentiment fell sharply to 31.8% from 39.8%. Optimism is at an unusually low level for the second consecutive week. Bullish sentiment is also below its historical average of 37.5% for the 65th time out of the past 67 weeks. The bull-bear spread (bullish minus bearish sentiment) fell for the third consecutive week, decreasing by 4.5 percentage points to –21.4%. NAAIM Exposure index decreased to 47.41 from 57.09 and now back under last quarters average of 51.03 for the first time since Jan 11th. Lipper fund flows for the week ending 3/1 had $13.5B of outflows in equities, the third straight week of outflows. Friday’s close saw NYSE new highs at 124 while new lows of 18 and the 10-day MA of New High/Low Differential is crossing negative at -37. The percentage of SPX stocks above their 50-MA is 53.8% while those above their 200-MA was 65.2%. NYSI and NASI Summation indexes are still below their 8-MA and in a short term sell signal. NYMO McClellan Oscillator closed at -4 and is now back at a neutral level. Cumulative AD line rebounded off the 40 EMA short term trend and still well above the 89 EMA long term bull signal. CBOE Equity P/C 50-day MA at 0.78 and falling as put arb trades slow. CNN Fear and Greed index is in Greed zone at 55 from 60 last week.