Weekly Market View 4-2-2023
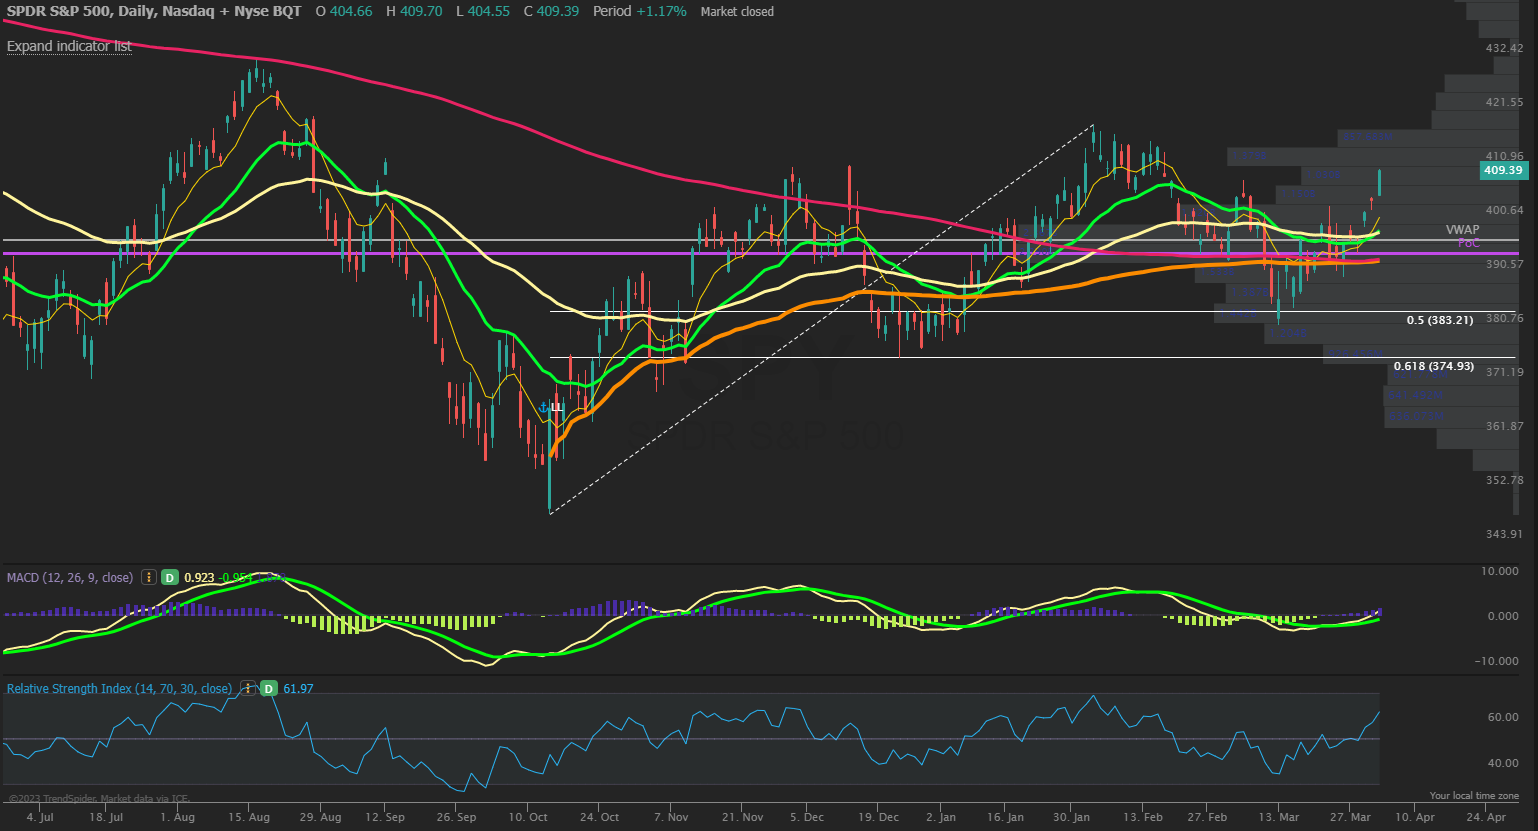
The SPX finished the week higher by +3.5% and closing the quarter strong with breadth surging the past week confirming the recent rally off lows as being supportive of a new trend underway. The early week pullback retested the 8/21 EMA’s and saw the VIX collapse under 20 showing more stability back above the SPX 4000 level which has been a key battleground for many months now as you can see in the SPY chart below showing the volume profile of the past year and the zone just under 400 being a confluence of congestion with the one year point of control and VWAP, along with the 200 day MA nearby. Support is strong now at 4000 and the 8 EMA at 4025 while SPX is now closing back over the 4100 level and likely testing the February highs next at 4195 but the market can use a pause or bull flag consolidation from here. MACD and RSI also confirm the momentum higher staying in bull mode.
Market Sentiment/Breadth
AAII sentiment for the week ending 3/29 showed bullish responses rise slightly to 22.5% from 20.9% prior while bearish responses fell to 45.6% from 48.9%. Neutral sentiment rose to 31.9% from 30.2%. Pessimism among individual investors decreased but remains above average for the sixth consecutive week. The bull-bear spread (bullish minus bearish sentiment) rose by 4.8 percentage points to –23.1% but remains unusually low. The NAAIM Exposure index increased to 65.15 from 51.03 and is still at an overall neutral level but above last quarter’s average of 51.03. Lipper fund flows for the week ending 3/29 had a whopping $20.5B of outflows in equities, the 6th week of the last 7 weeks with outflows. Friday’s close saw NYSE new highs at 64 while new lows of 19 and the 10-day MA of New High/Low Differential is -55. The percentage of SPX stocks above their 50-MA is at 50.2% while those above their 200-MA was 60.0%. NYSI and NASI Summation indexes saw a positive cross above their 8-MA and in a short term buy signal. NYMO McClellan Oscillator closed at +86 after the strong move higher and now nearing short term overbought. The cumulative AD line surged above the 40 EMA short term trend and now back above the 89 EMA long term bull signal. CBOE Equity P/C 50-day MA at 0.68 and falling. CNN Fear and Greed index is back in Neutral zone at 49 from 37 last week. VIX/VXV ratio back down to 0.881.