Weekly Market View 6/13/21
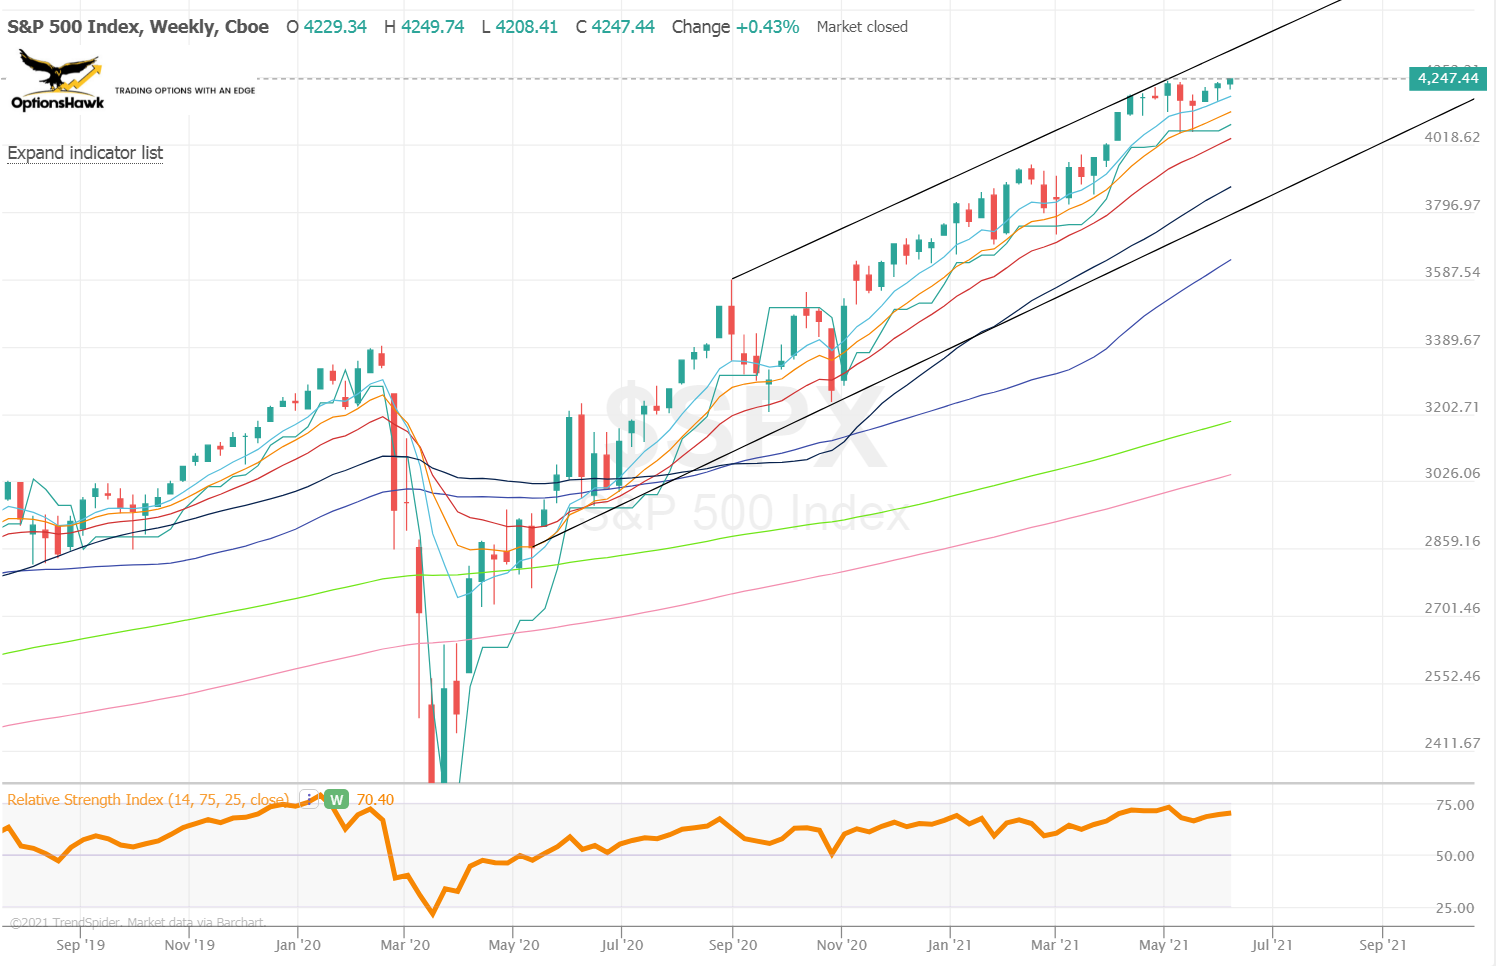
The S&P (SPX) closed the week near record highs as it started to emerge out of a multi-week consolidation with the current flag measuring around 300 points to a 4550 target. It has been a straight grind higher since the 5/19 reversal candle off the rising 55-day moving average. The current support levels of interest are 4225, 4205, 4190, 4147, 4110, and 4060. The volume profile points to real trouble under the 4110 level with a pocket back to 3980 or 3940. For now the trend remains very favorable but be on watch for any signs of weak closes and violations of the key moving averages or prior day closes. Although the VIX is at its low for the year there are several potential upcoming sources of volatility including inflation surprises, higher rates, corporate/capital gains tax reform, Tech regulation and Geopolitics. The S&P now trades 22X NTM earnings, near historic highs.
AAII Investor Sentiment for the week ended 6/9 remained consistent with recent readings as Bulls dropped to 40.2% from 44.1% and Bears climbed to 20.7% from 19.8% while Neutral at 39.1% is hitting a multi-week high. NAAIM Exposure Index remained elevated but did top to 79.65 from the prior week reading of 82.27 and waiting on readings above 95 to grow more concerned. It was a quiet week of flows with Lipper showing $717M of equity fund inflows. As of Friday’s close we say 564 new highs and just 29 new lows with 72.5% of stocks above the 50-day moving average and 76% above the 200-day moving average, strong breadth and participation. The CBOE Equity Put/Call 50-day moving average at 0.48 remains well above early 2021 lows but has pulled back more recently. NYSE and Nasdaq Summation indicators, NYSI and NASI, both remain trending higher and in buy signals. NYMO finished the week +27 which is near the top -end of readings in 2021 but still well below the historical peaking level around +55. The S&P stocks above the 50-day moving average has been weakening since early April and hitting a multi-week low last week, one bearish divergence forming. The VIX:VXV ratio at 0.8 is very low and near a level of concern. The Goldman Sachs Sentiment Indicator shows Neutral positioning. S&P short interest % of market cap media is at 1.6%, just off early 2021 multi-year lows.