Equity & Options
Market Research, Analysis
& Strategies

is the premier site for active option and equity traders offering real time coverage of markets via options activity alerts, technical set-ups, breaking news, in-depth research and much more.


Set-Ups

Talk

Weekly
market
View
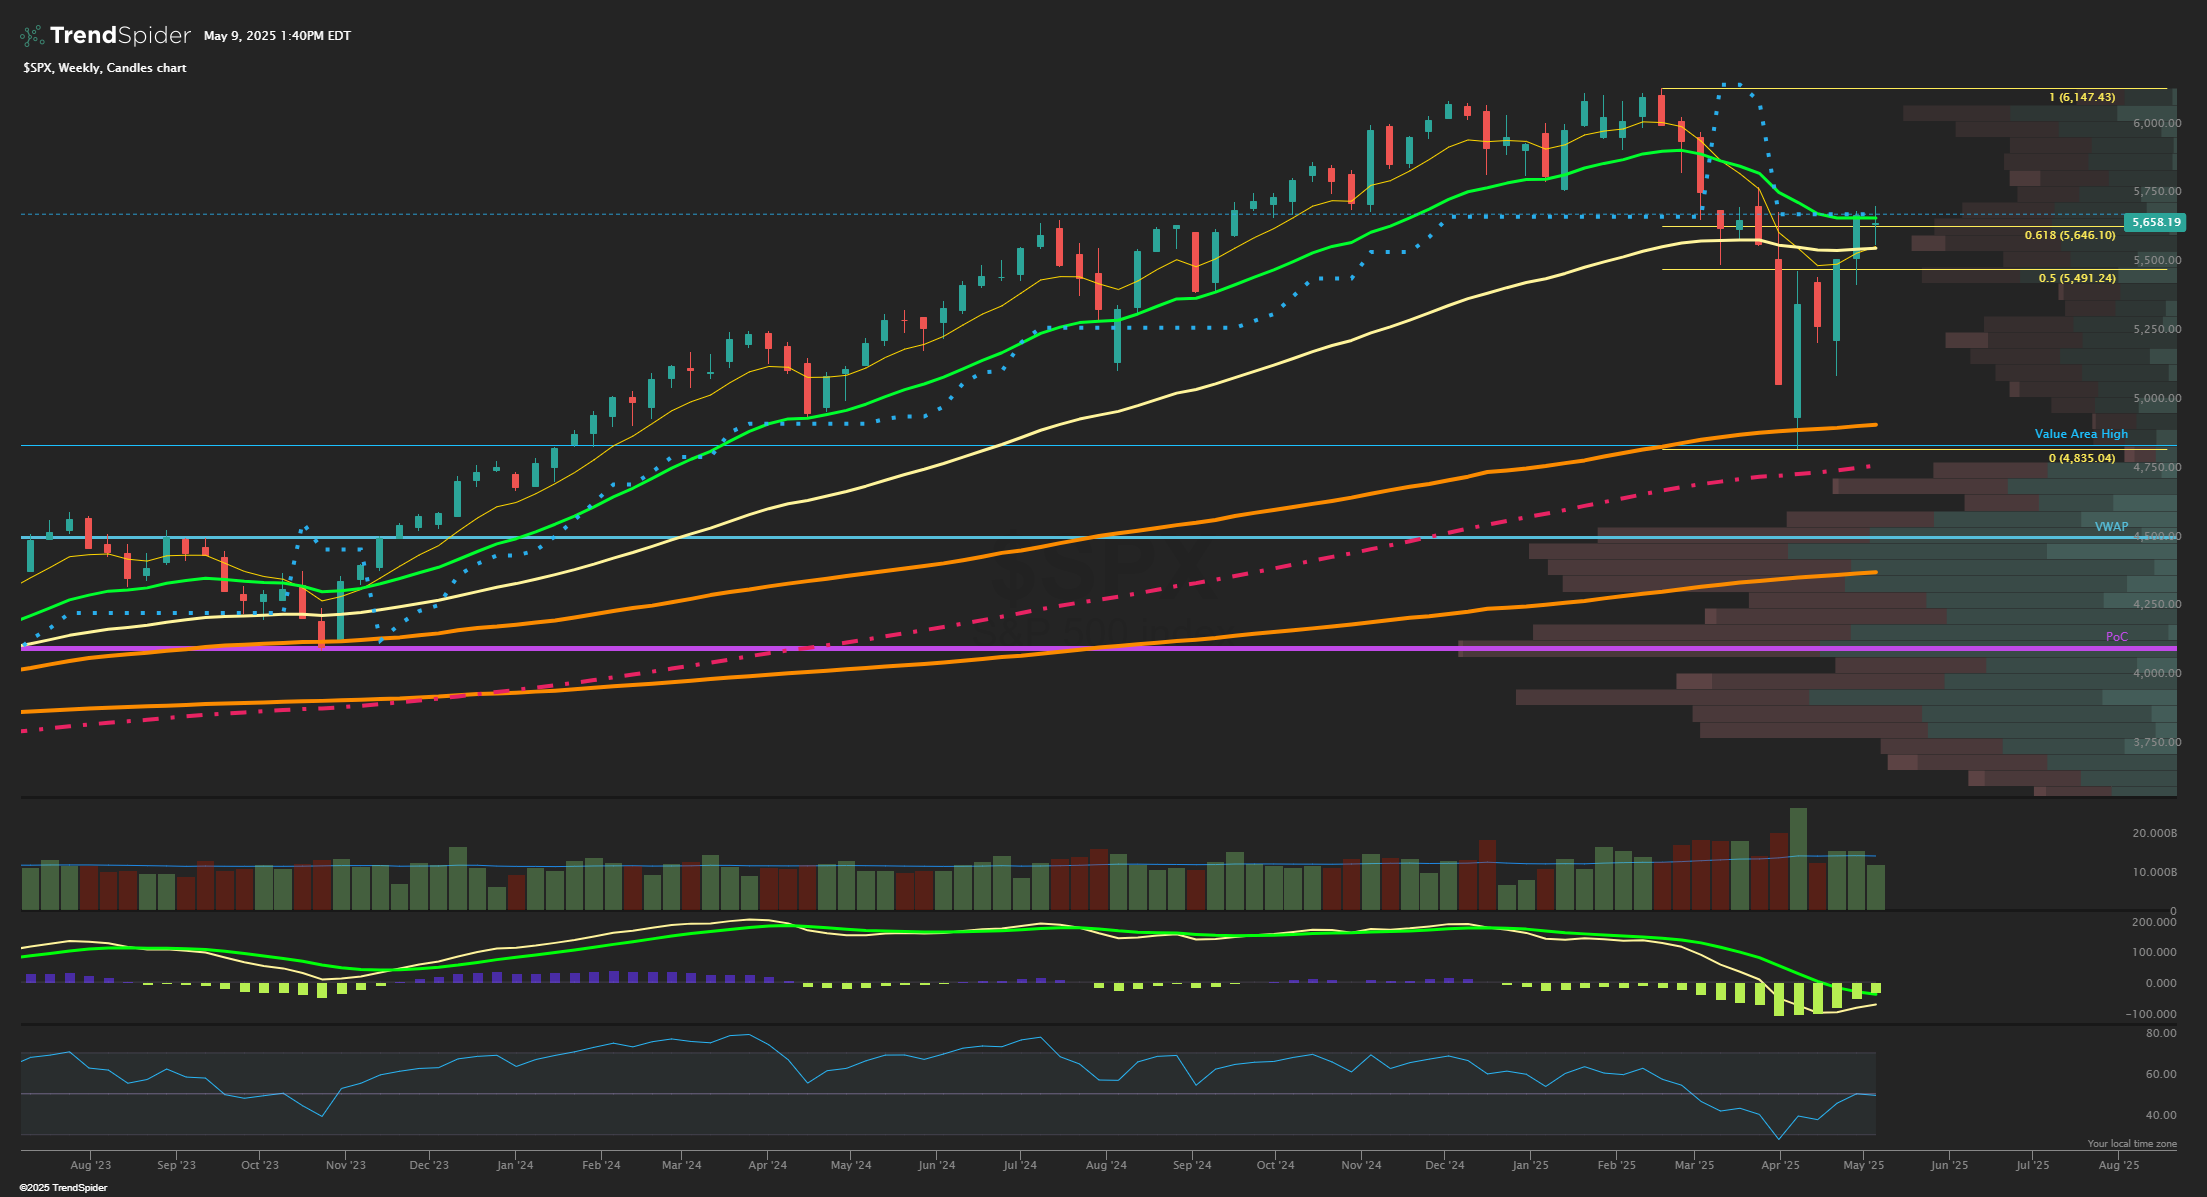
Technical Market View
The SPX closed mostly unchanged for the week but spent the week seeing dips bought anytime prices came back towards 5600 midweek and were holding above the 200 EMA currently at 5640. The 61.8% Fibonacci retracement at 5646 also seeing prices close above this week which likely points to more upside at some point in this uptrend but now potential to consolidate further into May expiration week on deck next. Markets have stayed resilient and while SPX has a lot of resistance in the 5750-5800 zone, plenty of single stocks have emerged from basing patterns to lead the indexes higher. Potential to see some backing and filling continue on the broad averages into an expiration week that is pricing in about 135 points of movement for the week based on May 16th options. VIX has further receded back to under 22 as realized volatility also shrinks, all good signs for markets. Clearly crypto markets like Bitcoin have been leading the risk on advance in equities and should continue to be a tell going into the second half of May and the rest of Q2 as Bitcoin clearing that 61.8% fib retrace of its own seems to be suggesting SPX prices will push higher and do the same. A lot of sentiment readings have normalized from extreme oversold levels so now it becomes more important for the SPX to be drive by a continuation of the strong expanding breadth metrics that produced the Zweig breadth thrust in late April.
Market Sentiment/Breadth
AAII sentiment for the week ending 5/7 showed bullish responses rise to 29.4% from 20.9% prior while bearish responses fell to 51.5% from 59.3% but stayed unusually high even after this sharp rally. Neutral sentiment fell to 19.8% from 22.5%. The bull-bear spread (bullish minus bearish sentiment) increased 16.3 percentage points to –22.1%. The bull-bear spread is below its historical average of 6.5% for the 18th time in 20 weeks and is below –20.0% for the 11th consecutive week. The NAAIM Exposure index rose to 81.06 from 59.92 last week and is now back above last quarter’s Q4 average of 72.50. Total equity fund flows for the week ending 4/30 had $-14.8 billion in outflows in equities. The prior day’s close saw NYSE new highs at 50, while new lows at just 24 and the 10-day MA of New High/Low Differential is rebounding to positive at +5. The percentage of SPX stocks above their 50-MA is at 62.2% while those above 200-MA was 43.8%. NYSI Summation index is still firmly above its 8-MA for a short-term bullish signal. NYMO McClellan Oscillator closed at +51 and now back to Upper Neutral zone short term. The cumulative AD line stayed strong and is above the 40 EMA short term breadth trend and above the 89 EMA long term bull signal showing the recent bottom is likely secure. CBOE Equity P/C 50-day MA is at 0.61. CNN Fear and Greed index is in Greed zone at 62 from 43 last week. The VIX/VXV ratio closed at 0.937 and under the key 1.0 level of inversion. This measures the spread between 1- and 3-month implied volatility, above 1.0 shows fear and can mark a low.
Open
Interest
Alerts
WEAV impressive trend, name that has 7000 February $15 calls in open interest from late October action at $1/contract
WEAV develops a customer communication platform for service-based businesses that offers voice, short message service, email and marketing services to dental, optometry, medical, and veterinary offices
WEAV has $1.16B market cap and trades 4.9X EV/Sales with revenues seen rising 15%+ annually each of the next two years. WEAV is levered to small and medium-sized healthcare practices with its current focus a $7B TAM, very niche business. The integration of fintech solutions like payment processing; buy now, pay over time; and payment plans is a natural progression to help practitioners accelerate collections and increase the acceptance rates of additional services.
WEAV recently launched Weave Platform which it calls the most significant product launch in the company’s history, at the forefront of administrative AI solutions for healthcare practices and an AI-powered Weave Assistant is integrated throughout the new platform. AI tools could automate nearly 45% of administrative tasks in the healthcare sector, potentially saving $150 billion annually. Weave Assistant helps craft personalized responses to reviews, write professional-branded e-mails, and automate tasks like message tagging and voicemail transcriptions. Our new call intelligence product leverages a custom AI model to extract actionable insights from call data.
Chart
Set-Ups
FactSet (FDS) long-time quality name w/ nice weekly 200-week EMA base now breaking over key levels with RSI and MACD bull triggers

Market
Talk
Stocks opened a bit weaker as the S&P and Nasdaq rallied back up to a major resistance point this week and the VIX remains elevated due to uncertainty on trade deals, Macro and the Fed. Stocks chopped around early and bounced as Michigan Sentiment came in better than expected. Markets, though, struggled to push through major resistance and volatility stayed bid. Software and Consumer Discretionary were strong again while Bonds rallied as well but overall a more mixed tape today with more industries red. Markets dipped midday on Trump tariff headlines but quickly rebounded back to near highs to close solidly green and VIX bled lower as stocks continue to show a change of character back to the bullish side with correlations also dropping being a tailwind.
What’s On Tap: : Looking out to next week, Macro starts the week quiet before GDP on Wednesday and Jobs Report on Friday as two key events. Earnings pick up sharply with key reports due from AAPL, MSFT, AMZN, META, LLY, V, MA, KO, MCD, LIN, QCOM, BKNG, AMGN, SPGI, CAT, SYK, HON, SPOT, ETN, KKR, AMT, WELL, SBUX, WM, SHW, UPS, CVS, TT and many more.
Flow
Recap/
Highlights
The final full week of April began with Put buyers targeting Telecom winners VZ and T as yields surge. We noticed early lower Delta June put sales to open in Airlines UAL and DAL. Large put sales in Biotech names for August with VKTX, SRPT and BEAM. Similar plays PAGS and STNE saw size January 2027 call buys open. By Thursday and Friday the markets tone change emerged more bullish with massive June 2027 call buys in GOOGL, ARM, NFLX and AMZN, good sign for Tech longer-term. META and MSFT also saw massive call buys on other timeframes. Retail plays RL and BOOT saw large call spreads buy in the afternoon session.
OptionsHawk

OptionsHawk is the premier site for active investors
We provide real time coverage of the market via options activity alerts, fundamental research, breaking news, technical set-ups and alerts, earnings strategies, sell-side commentary and much more. We provide a full suite of research and analysis to allow investors to make better informed decisions.
Our Mission
OptionsHawk is an idea generation and research platform providing accurate, unique, and high quality analysis of the equity and options market in real time. OptionsHawk aims to be the premier community for traders and investors as we simplify and maximize the efficiency of your research process while also handpicking and presenting the best ideas based on our many years of experience in a concise and timely manner.
Our Process
We integrate all methods into our process to give the most thorough assessment of a company, which includes fundamentals, technicals, institutional option and equity flows, management commentary, Macro views, catalyst discovery, and sell-side research.
Our Vision
The Hawk symbolizes the ability to use intuition and higher vision in order to complete tasks or make important decisions. Hawks also encourage you to use laser focus and precision to get things done, and to take the lead in life. The hawk represents focus, strength, and poise, and as messengers to learn powerful lessons or expand your knowledge and wisdom. The Hawk encapsulates our company vision.
Browse and Compare Options Hawk Products