Equity & Options
Market Research, Analysis
& Strategies

is the premier site for active option and equity traders offering real time coverage of markets via options activity alerts, technical set-ups, breaking news, in-depth research and much more.


Set-Ups

Talk

Weekly
market
View
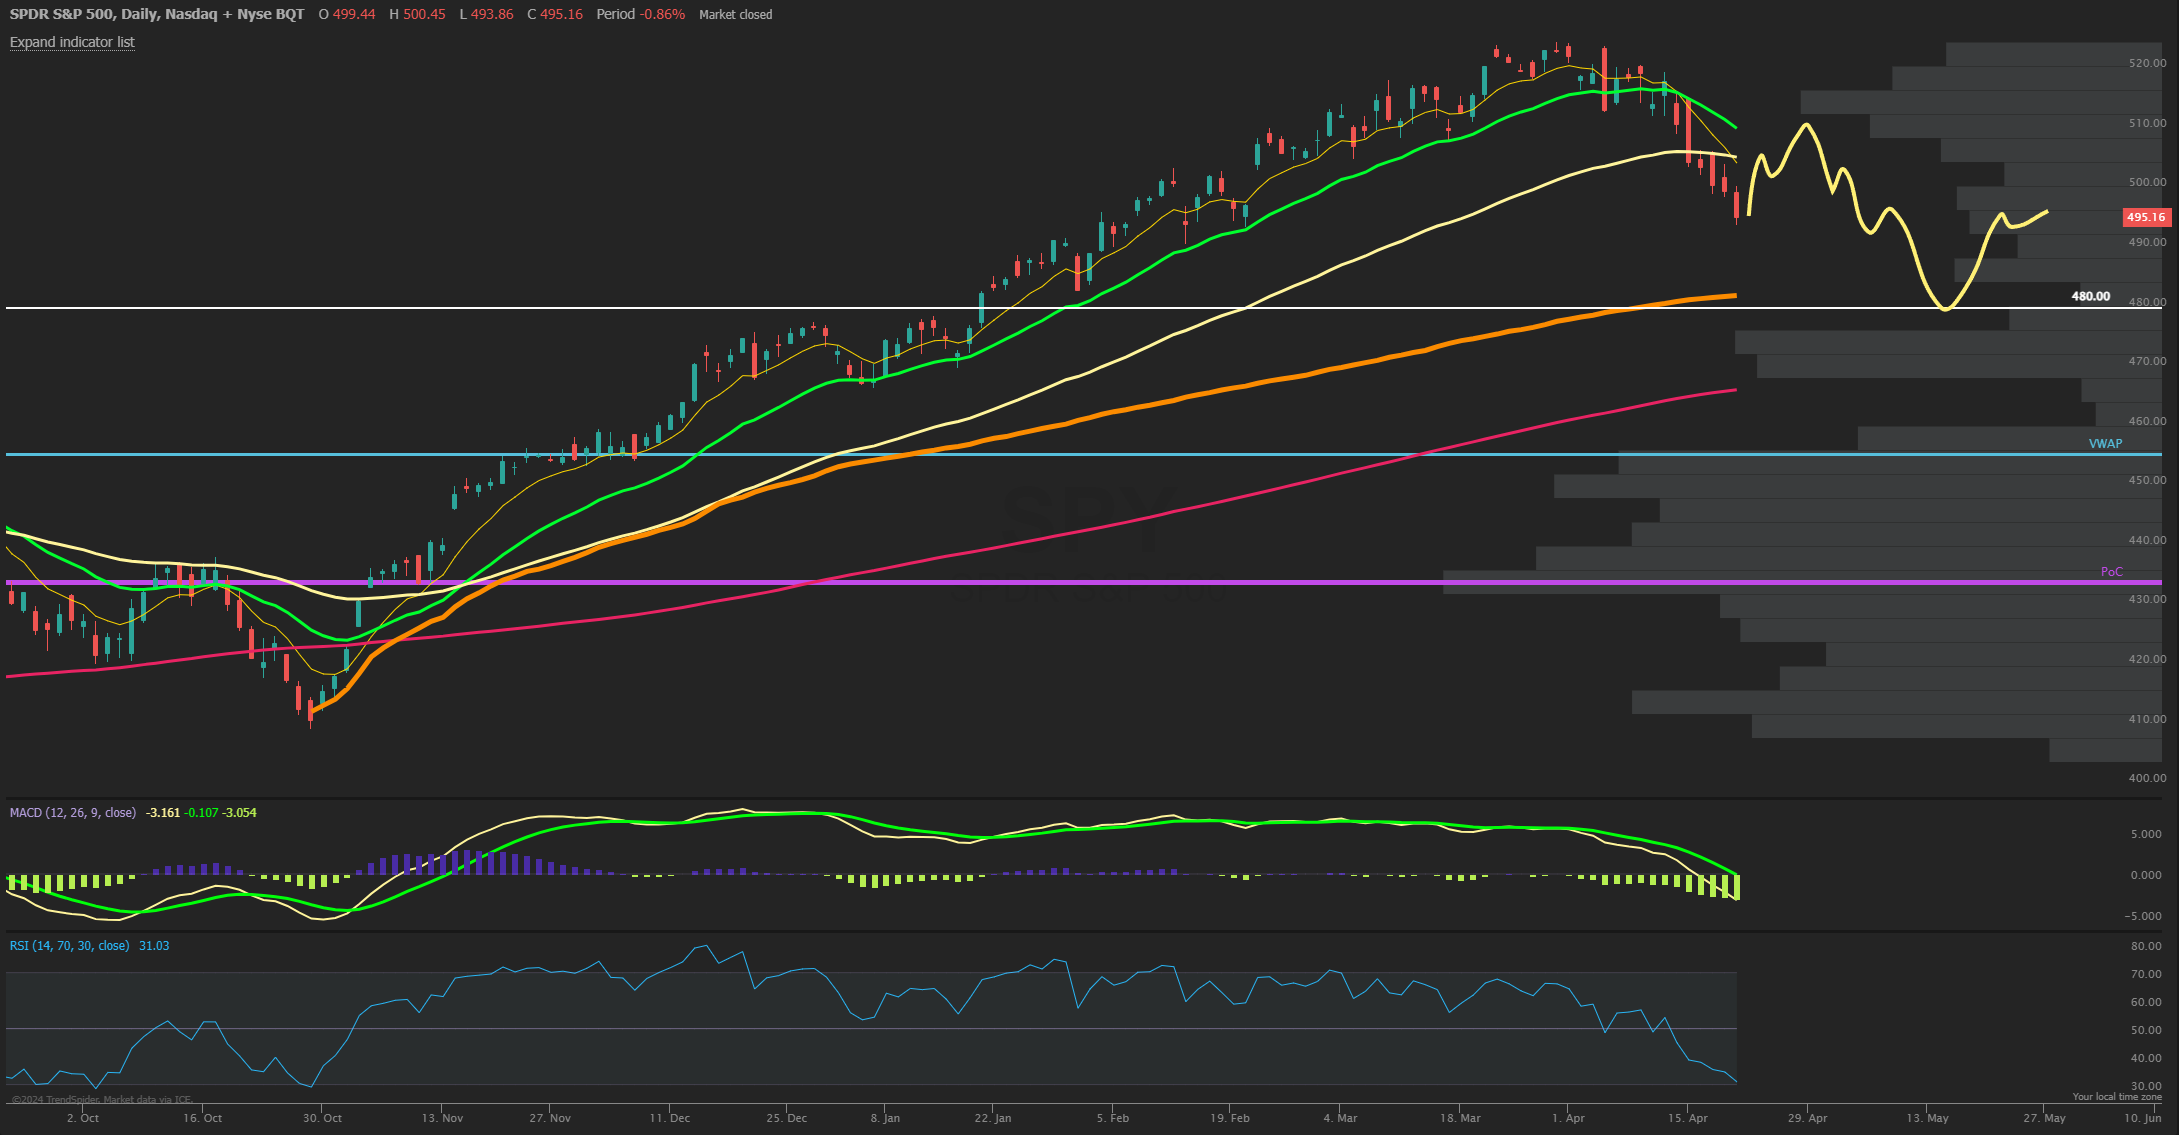
The SPX closed lower by -3% for the week that saw everyday close lower for one of the uglier weeks of the past year but not all that surprising based on what we have been seeing and warning of transpiring into the more bearishly tilted options market in a negative gamma status last week going into monthly expiration. These monthly OPEX weeks tend to keep the market in the direction of the short-term trend and then often can see a reversion to the mean the week after all those options expire. In this case that would point to a oversold snapback rally in the coming days likely, barring more headline news but I spent some time looking at different factors and scenarios to project a possible roadmap for SPY the rest of the month and into May. Seasonality favors the bears for now, but this week can easily bounce back to at least the 8 EMA near 505 which also lines up with the 55 MA and then the 21-day average just above at 510 as a likely stiff resistance point target on the rebound. Clearly the market is weak, but downtrends have sharp rallies, and one is surely brewing. With the gap near 497 having been filled last Friday, admittedly quicker than I expected but the next rally could be sold into that 505-510 range for a potentially stronger thrust lower back to the 480 level where a large confluence of major support lies. The prior all-time highs reside here and is the anchored VWAP (orange line) from the October lows. This also coincides with the 38.2% Fibonacci retracement. If earnings report stronger and global risks abate faster than expected then another leg lower may not be in the cards but this type of selloff generally will try to bounce and then be rejected to form a lower low, quite like the September through October correction.
Market Sentiment/Breadth
AAII sentiment for the week ending 4/17 showed bullish responses fall to 38.3% from 43.4% prior while bearish responses increased to 34.0% from 24.0%, the highest since early November. Neutral sentiment fell to 27.8% from 32.5%. The bull-bear spread (bullish minus bearish sentiment) decreased 20.8 percentage points to 4.3%. The bull-bear spread is below its historical average of 6.5% for the first time in 24 weeks. The NAAIM Exposure index decreased to 62.98 from 81.92 last week and is now well below last quarter’s average of 87.84. Total equity fund flows for the week ending 4/10 had $-14.9 billion of outflows in equities. Friday’s close saw NYSE new highs at 13 while new lows of 39 and the 10-day MA of New High/Low Differential is crossing negative at -7. The percentage of SPX stocks above their 50-MA is at 37.0% and now at a 5-month lows while those above their 200-MA was 70.8%. NYSI Summation index is below its 8-MA for a short term sell signal. NYMO McClellan Oscillator closed at -52 and bouncing from oversold. The cumulative AD line decreased this week and is under the 40 EMA short term breadth trend while still above the 89 EMA long term bull signal. CBOE Equity P/C 50-day MA at 0.65. CNN Fear and Greed index is in the Fear zone at 31 from 46 last week. The VIX/VXV ratio closed at 0.972. This measures the spread between 1- and 3-month implied volatility, above 1.0 exhibits fear and tends to mark a low.
Open
Interest
Alerts
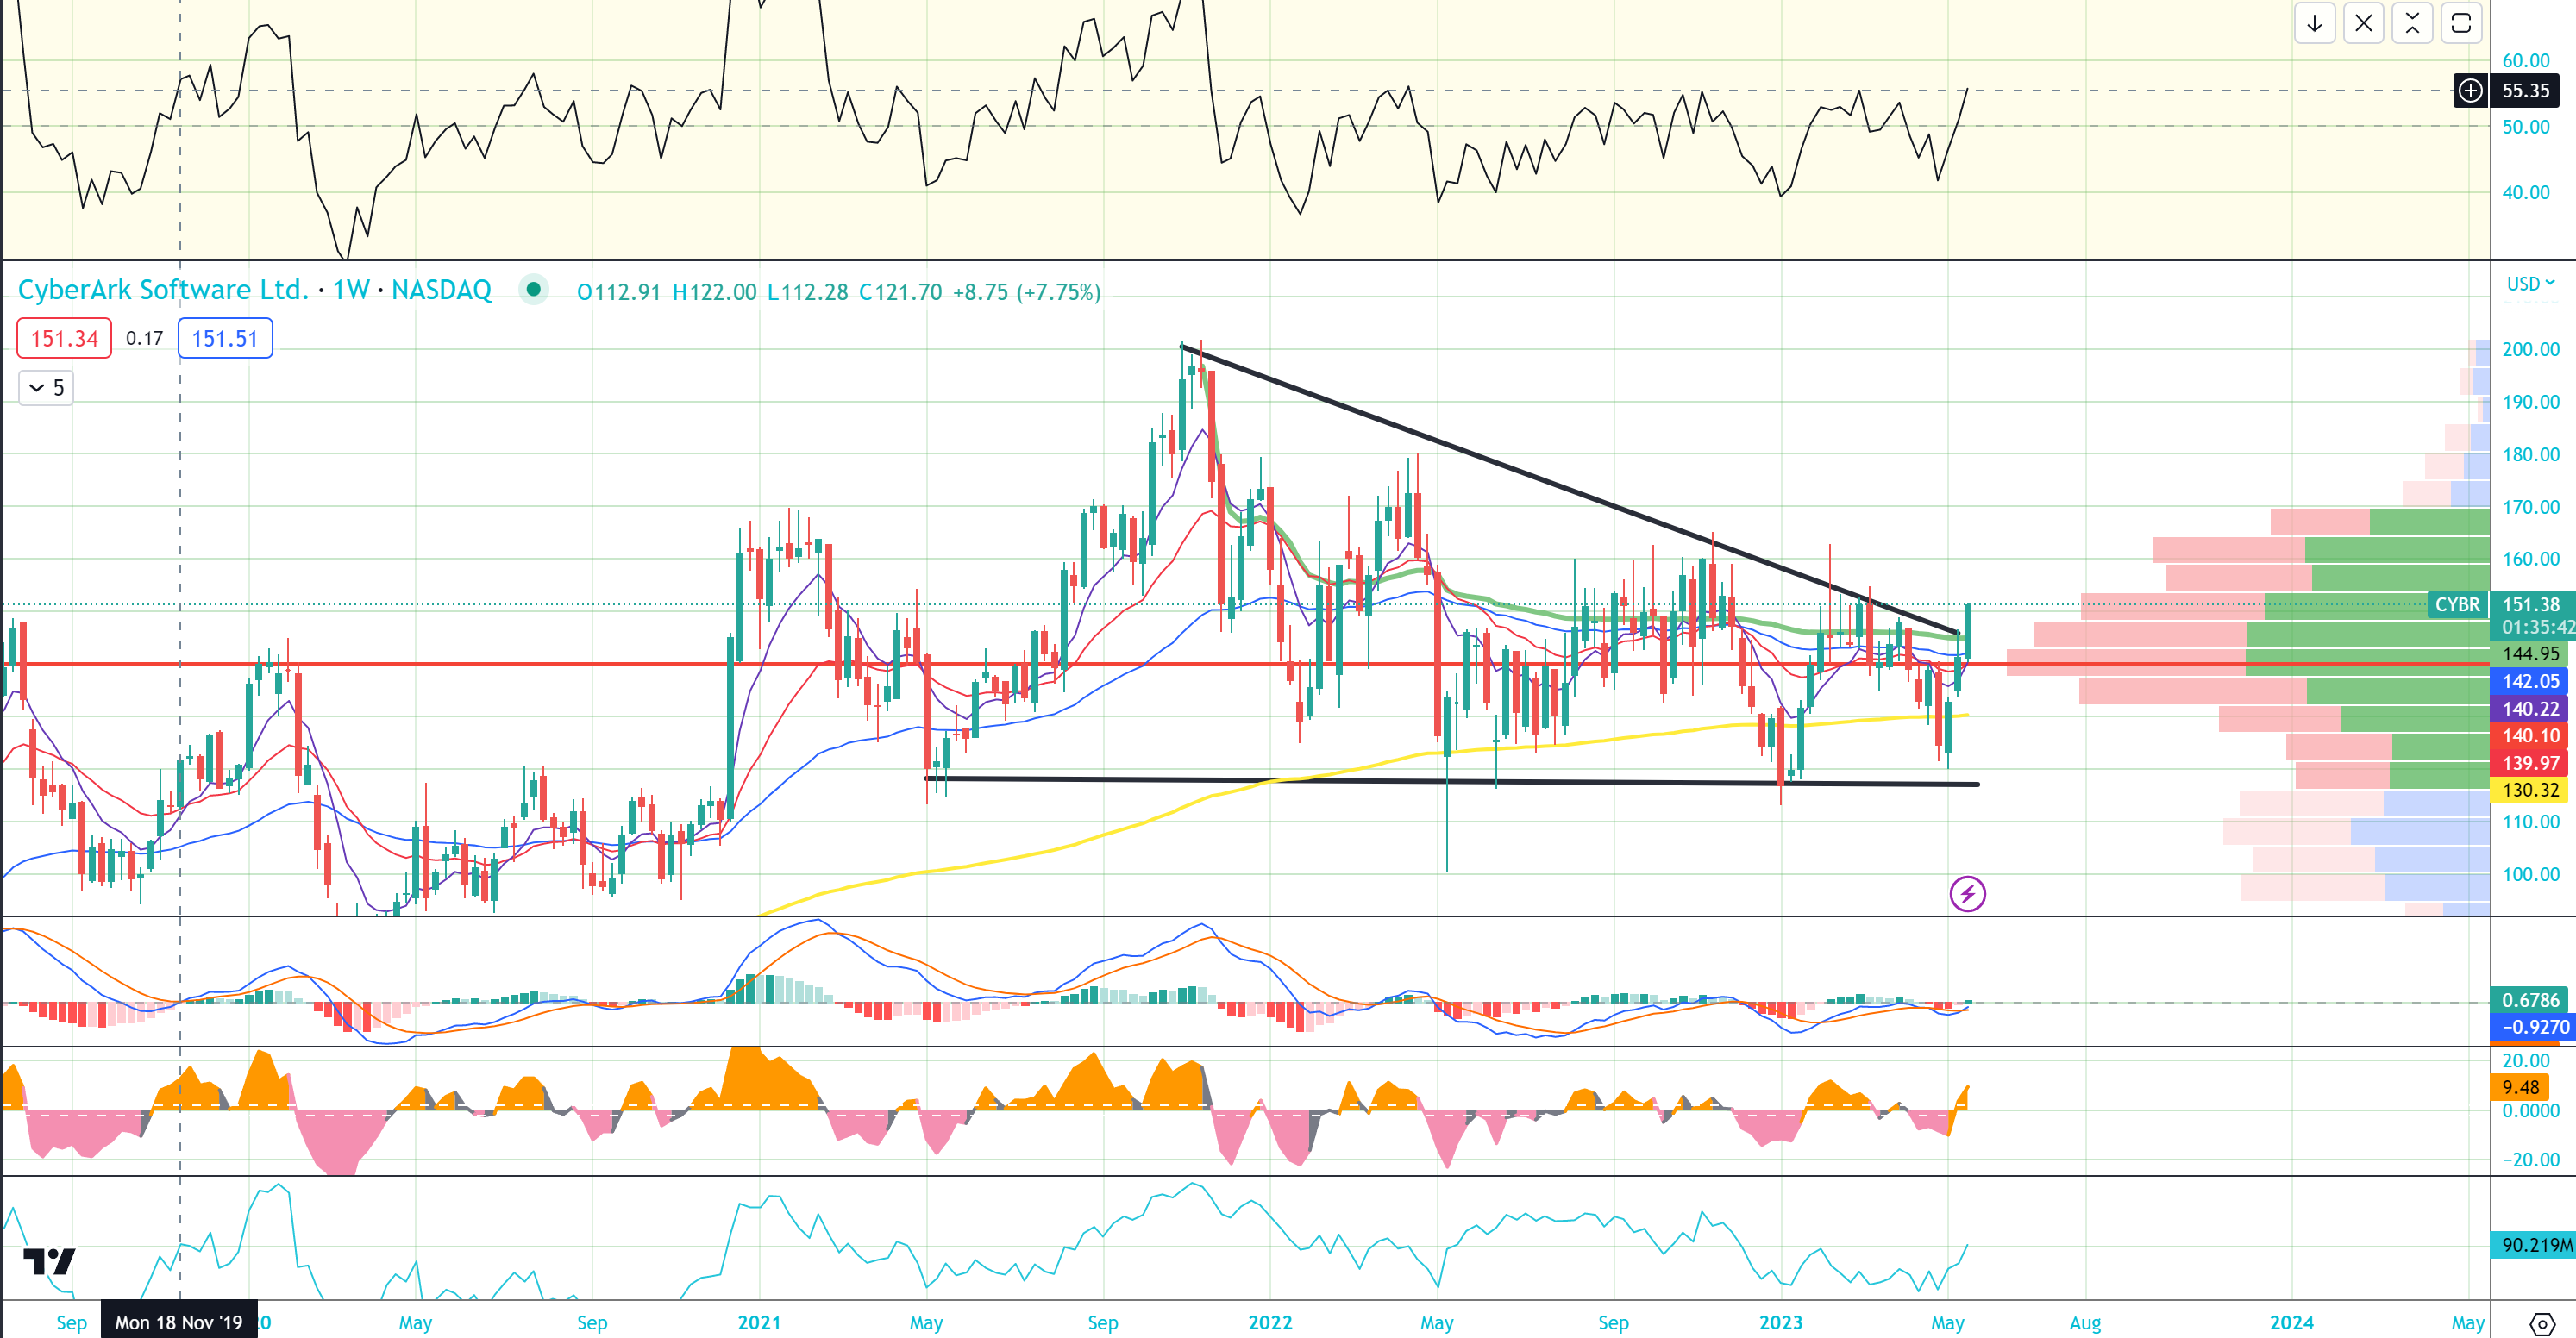
CyberArk (CYBR) on 4/17 with an unusual buy of 1000 December 2024 $160/$230 call spreads and a lot of earnings reports due from the group the next two weeks while M&A remains a key theme to the group.
CYBR shares are on a third week of a rally working over VWAP from record highs, triggering a bull weekly MACD cross and weekly RSI to the highest level in 18-months while shares show a major long-term trend inflection. The $160 level is the next challenge and above that the $120/$160 range break measures to $200. Shares are also working on a massive monthly bull engulfing candle.
Chart
Set-Ups
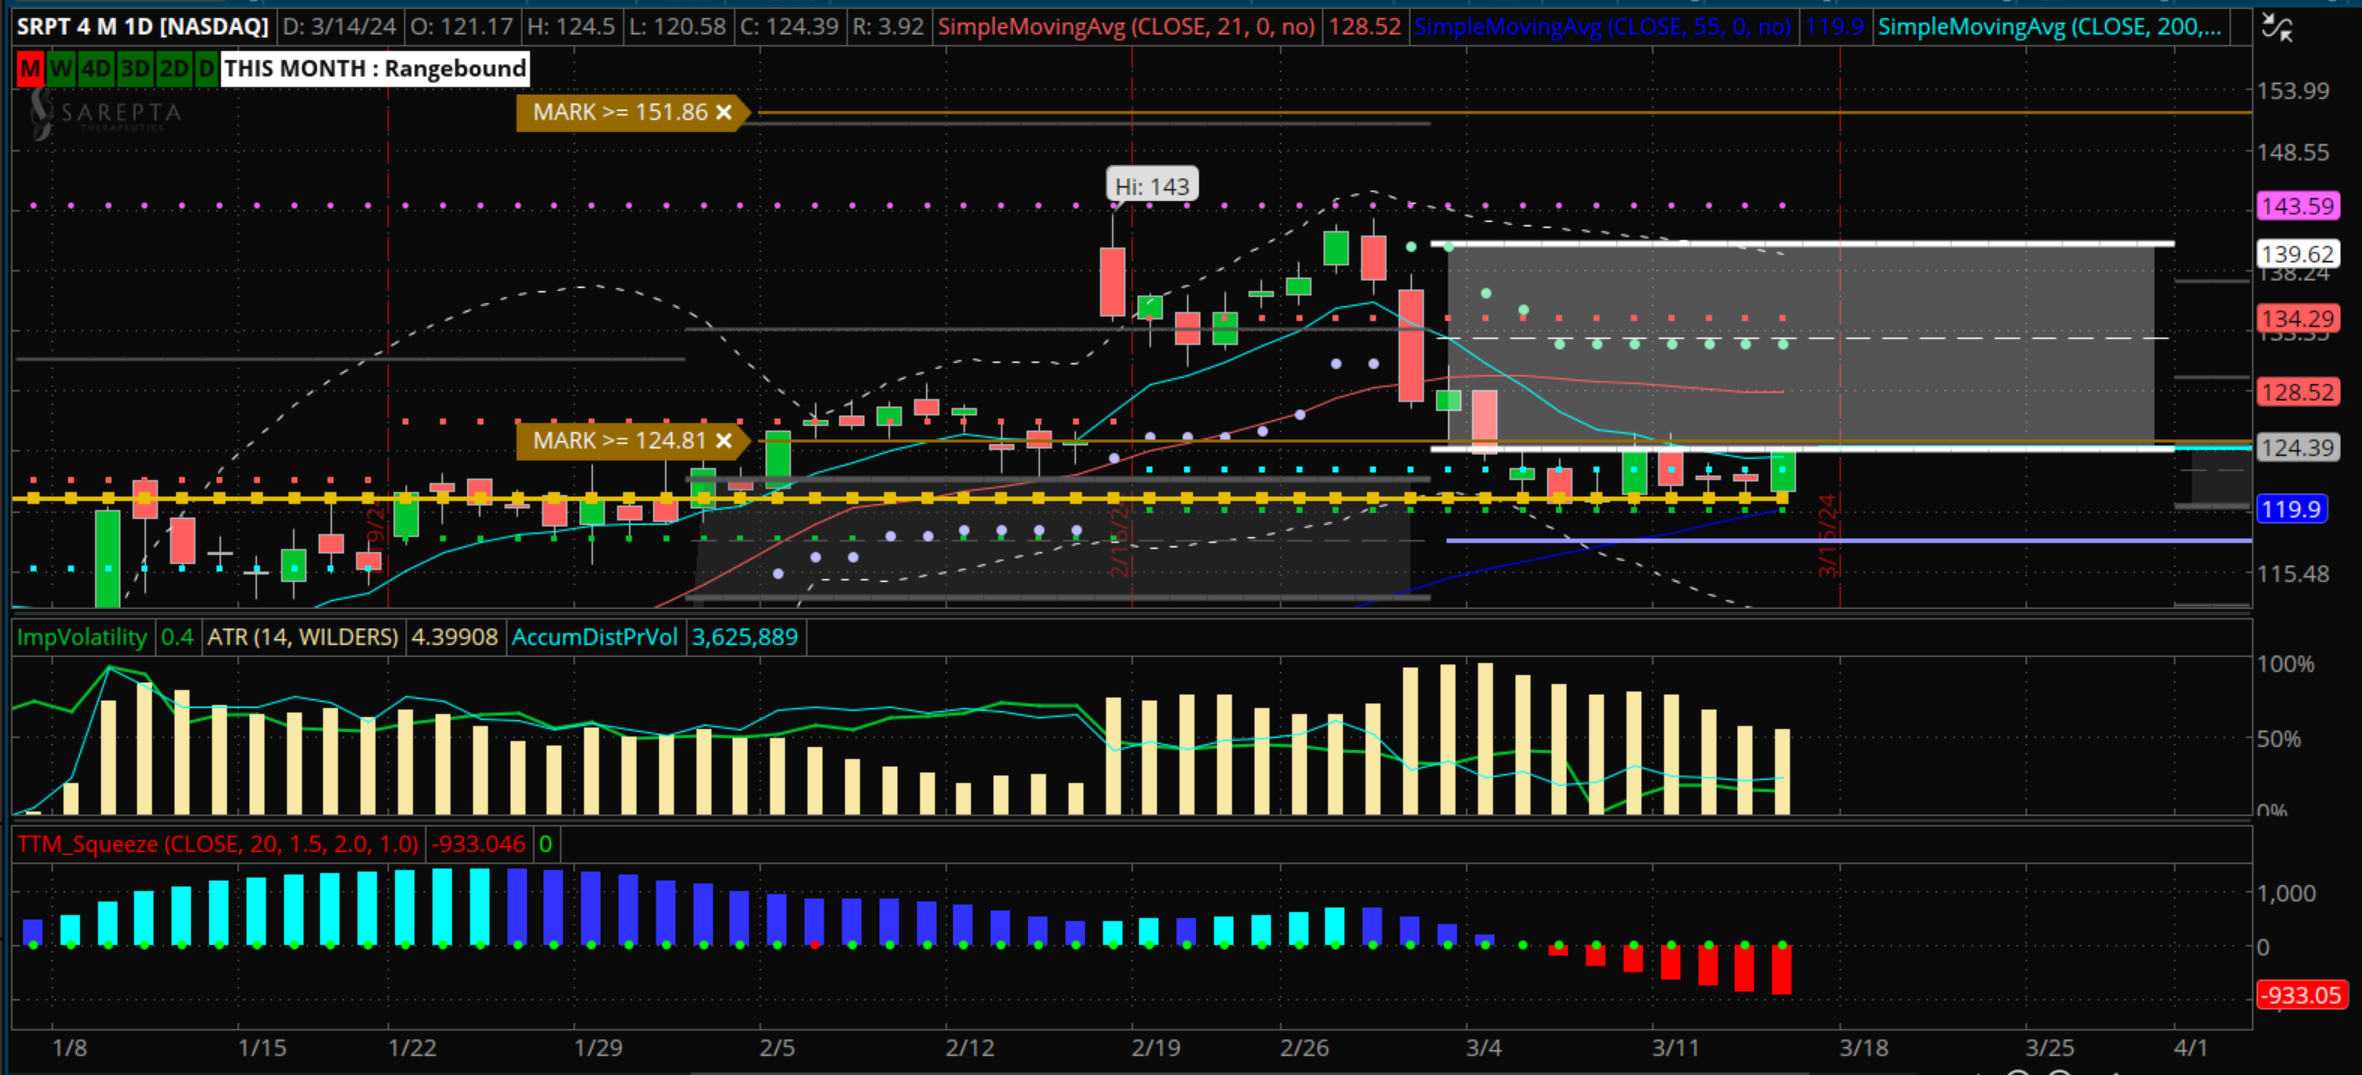
SRPT Bio with rel. strength today and recent upside call spread buys in size, held right on 1-year VPOC and now trying to clear 8-MA and back inside value, over 125 should lead to nice run higher
Market
Talk
Stocks gapped higher led by Tech on the Google/Microsoft results and the BOJ stayed on hold with rates. Futures held gains after March inflation numbers came in at expected levels, Income matched the consensus and Spending beat estimates. Strength was led by Tech with upside in Semis, Internet and Software while Retail also outperformed and most every sector strongly green with positive breadth all morning. Energy, Insurance and Transports were weaker groups. We head into a major week for Macro, the Fed and Earnings with the rebound hitting some key resistance levels and risks to a move lower remaining. The market largely grinded into the close back towards the 5100 SPX round number level with a pretty quiet overall day into that monthly value area resistance. SPX options for next week pricing in a move of near +/- 86 points.
What’s On Tap: In Macro, Chicago PMI Tuesday and end of the month, ISM and Fed on Wednesday, Factory Orders Thursday and Jobs Report on Friday. Earnings also very active with top reports due from AAPL, AMZN, LLY, MA, NVO, KO, AMD, LIN, MCD, QCOM, COP, AMGN, SYK, ETN, BKNG, ADP, CI, SBUX, REGN, MDLZ, KKR, APO, AMT, ICE, ITW, PH, MAR, ZTS, MCO, TT, PYPL, PXD, NXPI and more.
Flow
Recap/
Highlights
The start of the week of 4/22 saw some November put sales in quality large caps with MA, WYNN notable today. We saw more November put selling in quality large caps like AMZN, BRK.B. We had more August call buys in Defense plays GD, LDOS. We also saw calls close across Insurance stocks. By midweek, Call buyers came back into Defense primes LMT, NOC, LDOS and GD in early action on Middle East tensions.
OptionsHawk

OptionsHawk is the premier site for active investors
We provide real time coverage of the market via options activity alerts, fundamental research, breaking news, technical set-ups and alerts, earnings strategies, sell-side commentary and much more. We provide a full suite of research and analysis to allow investors to make better informed decisions.
Our Mission
OptionsHawk is an idea generation and research platform providing accurate, unique, and high quality analysis of the equity and options market in real time. OptionsHawk aims to be the premier community for traders and investors as we simplify and maximize the efficiency of your research process while also handpicking and presenting the best ideas based on our many years of experience in a concise and timely manner.
Our Process
We integrate all methods into our process to give the most thorough assessment of a company, which includes fundamentals, technicals, institutional option and equity flows, management commentary, Macro views, catalyst discovery, and sell-side research.
Our Vision
The Hawk symbolizes the ability to use intuition and higher vision in order to complete tasks or make important decisions. Hawks also encourage you to use laser focus and precision to get things done, and to take the lead in life. The hawk represents focus, strength, and poise, and as messengers to learn powerful lessons or expand your knowledge and wisdom. The Hawk encapsulates our company vision.
Browse and Compare Options Hawk Products