Weekly Market View 12-29-24
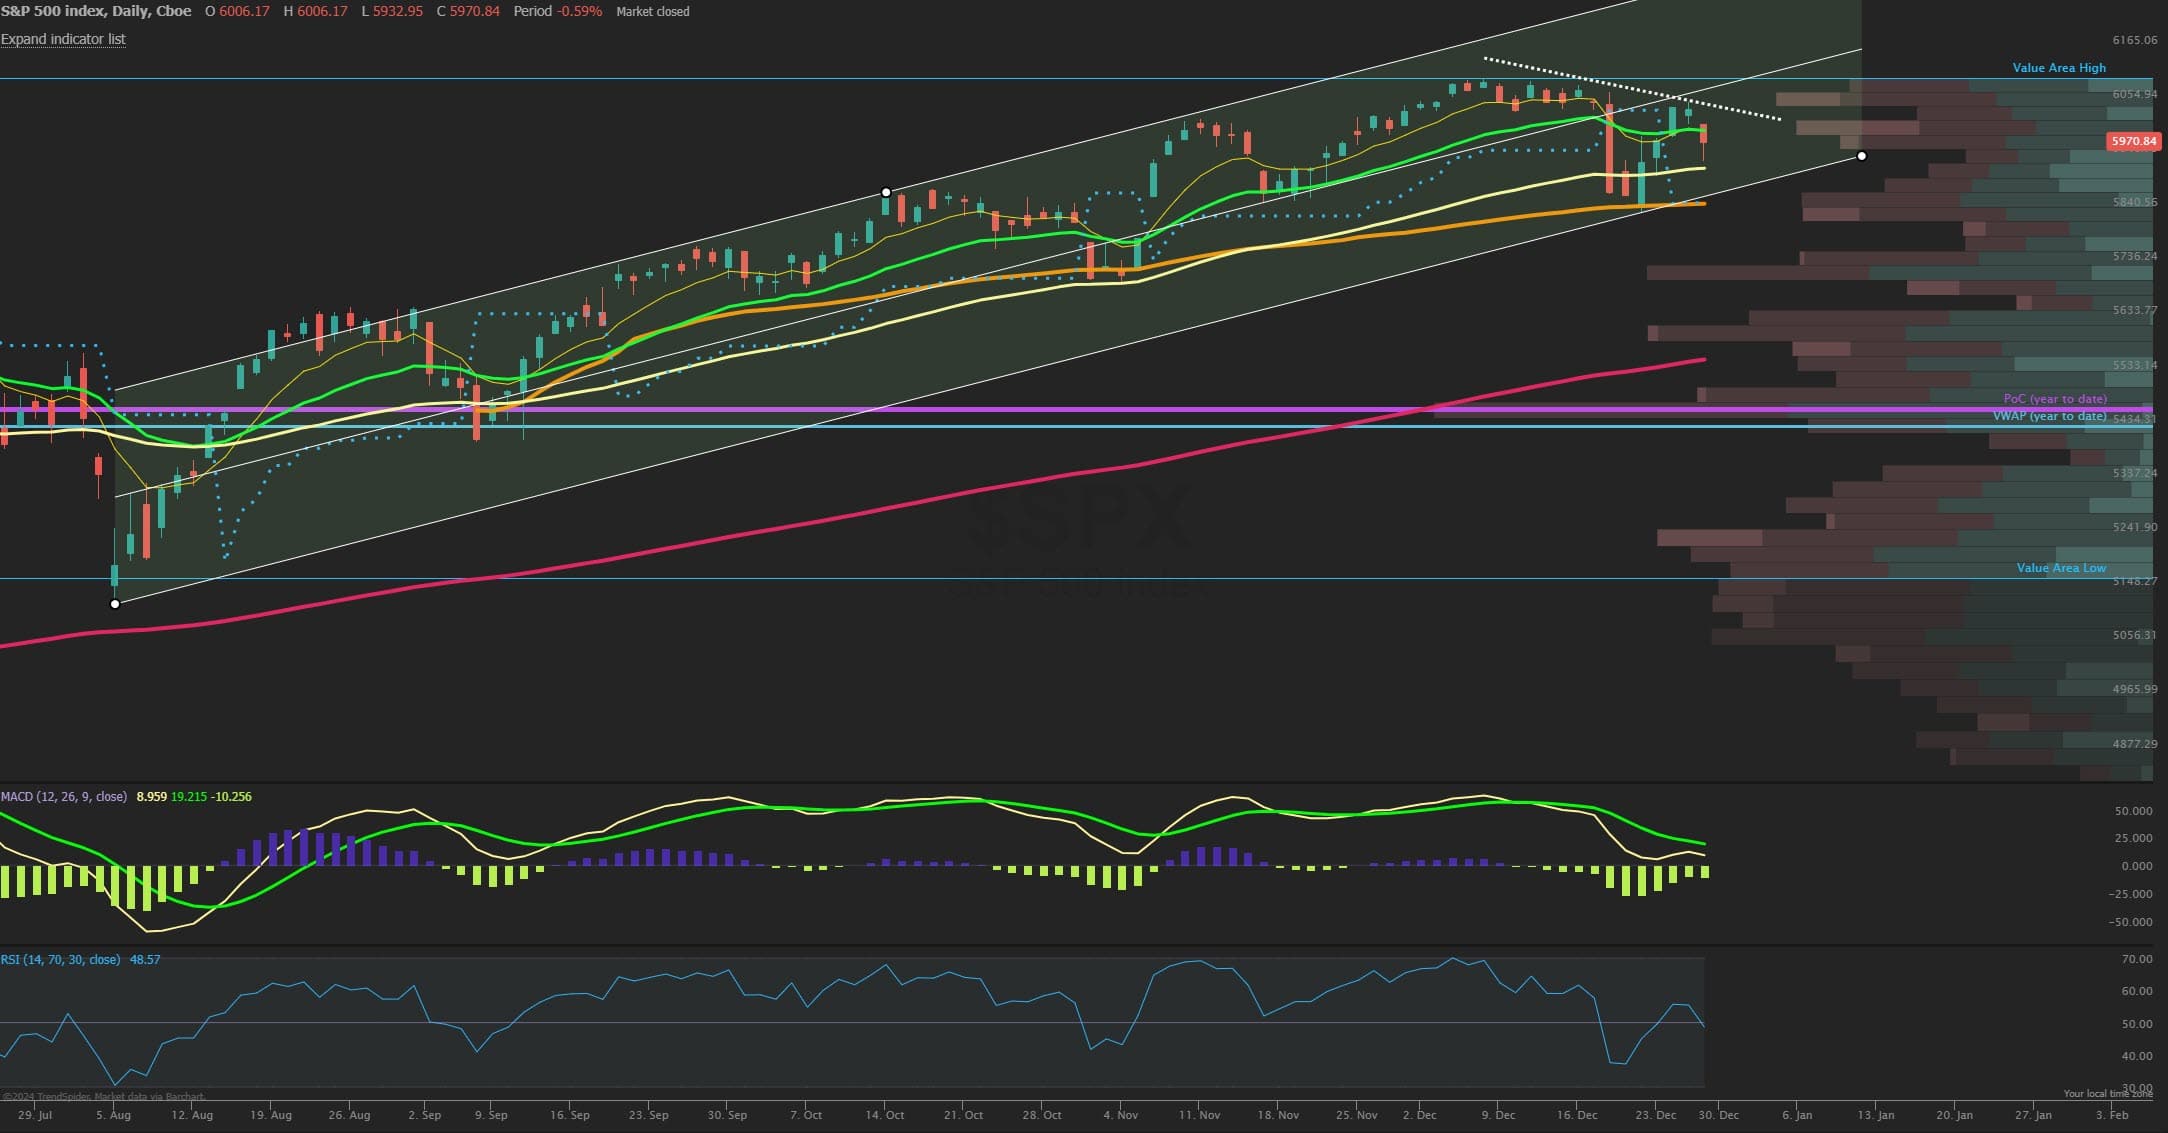
The SPX closed higher on the week by +0.7% even after the Friday selloff retraced some of the strong four day advance but still overall closed the week above its 55 day MA support of 5920 and the late day rally nearly got back to 6000 which should be a key line in sand going into the first week of the new year. A move back over that for Monday would likely see a magnet potentially into 6055 for the quarterly expiration on Tuesday 12/31 which is the JPM collar strike and really a large reason why the SPX has been unable to close above the 6055 zone since December options expired. Breadth has been a touch better the past week but still needs to improve if the typical Santa rally strength continues into the first two days of the new year which is the norm. A close above 6000 would bring stability from a gamma standpoint and serve to decrease volatility into the new year. After Jan 1st there likely can be an unpinning of that zone which has been a sticky magnet and market breadth would likely point to the direction for the first week of January. A move above 6055 can see a stronger breakout above this past months consolidation which now looks setup better after sentiment got a big washed out since the FOMC selloff. While upside bias is more likely, any close back under the 55-day MA near 5920 would trigger higher volatility and risk off which would target the prior low at 5835. RSI is holding right at the 50 midpoint market while MACD is trying to curl higher for a possible bullish cross into the new year.
Market Sentiment/Breadth
AAII sentiment for the week ending 12/25 showed bullish responses fell to 37.8% from 40.7% prior while bearish responses ticked up to 34.1% from 31.7%. Neutral sentiment rose to 28.0% from 27.9%. The bull-bear spread (bullish minus bearish sentiment) decreased 2.4 percentage points to 9.3%. The bull-bear spread is above its historical average of 6.5% for the 31st time in 33 weeks. The NAAIM Exposure index fell to 80.39 from 82.50 last week and is back near last quarter’s average of 80.82. Total equity fund flows for the week ending 12/18 had $-33.9 billion in outflows in equities. Friday’s close saw NYSE new highs at 24, while new lows of 121 and the 10-day MA of New High/Low Differential is negative at -109. The percentage of SPX stocks above their 50-MA is at 27.0% after touching near 20% which is often a bottoming signal, while those above their 200-MA was 57.6%. NYSI Summation index is below its 8-MA for a short-term bearish signal. NYMO McClellan Oscillator closed at -35 and is just below Neutral again. The cumulative AD line is under the 40 EMA short term breadth trend and did close just below the 89 EMA long term bull signal for potential for rallies to be rejected if can’t reclaim that level. CBOE Equity P/C 50-day MA is at 0.55 and lows for this year. CNN Fear and Greed index is back into the Fear zone at 34 from 28 last week. The VIX/VXV ratio closed at 0.88 and peaked above 1.1 recently, which is often a sign of a market bottom. This measures the spread between 1- and 3-month implied volatility, above 1.0 shows fear and can mark a low.