Weekly Market View 1-12-25
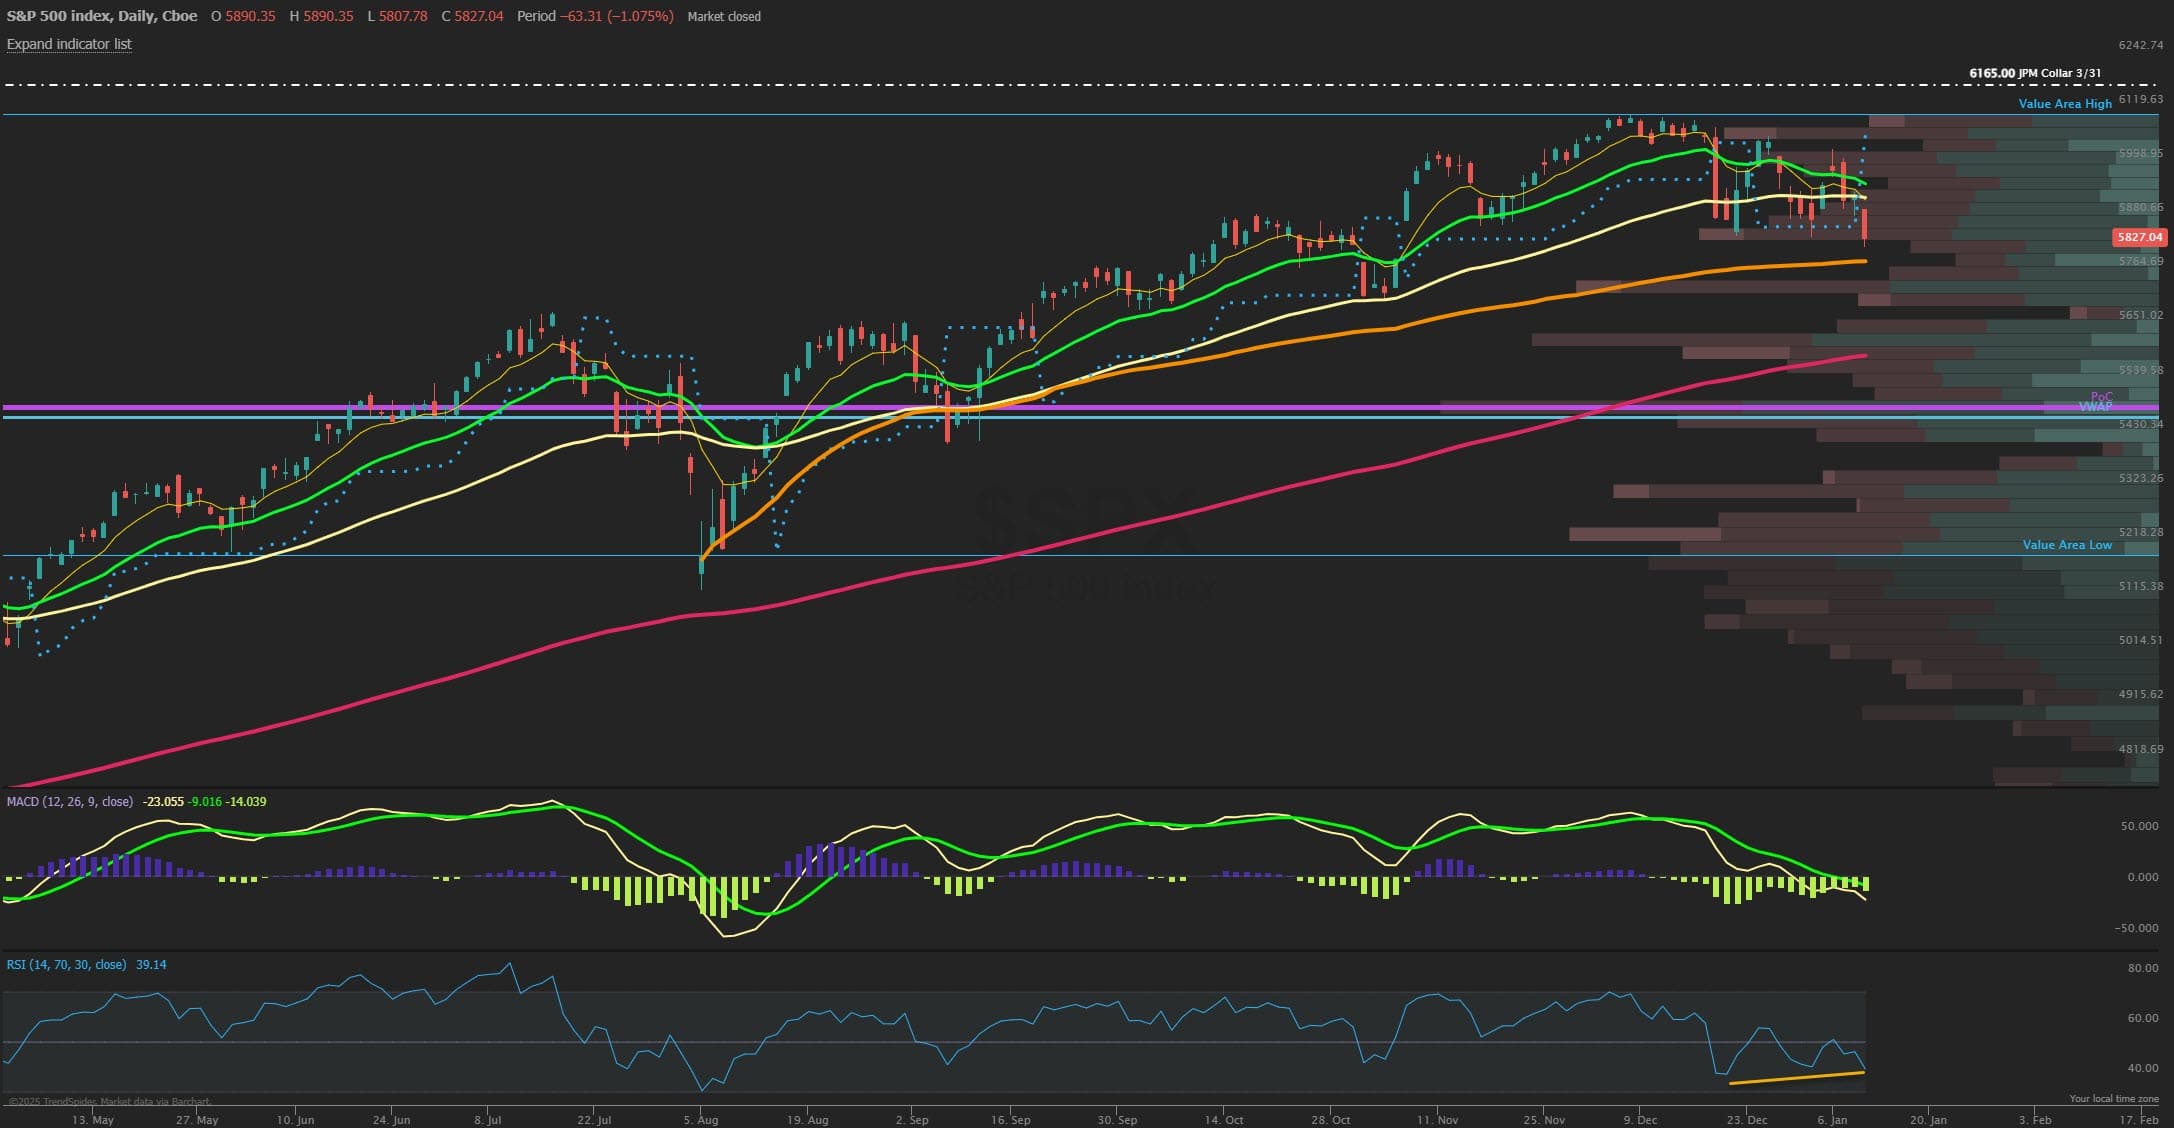
The SPX closed lower on the week by nearly -2% after starting the week with a gap higher that made its peak near 6025 before slipping lower into the employment report Friday and now getting closer to filling that elusive election day open gap near 5780 which would likely offer a solid risk/reward for a rebound as stronger support from the late October and early November period. RSI also continues to form some small bullish divergence into these dips and overall a market very much tied to the correlated interest rates right now so any relief bounce in bonds can see a surprise uptick in SPX. This potential scenario for a pullback in yields could transpire this week with a cooler CPI report and with it being a large January options expiration week there is plenty of fuel for a snapback move after the VIX expiration passes on Wednesday. Interestingly the 52780 gap fill also now lines up perfectly with the anchored VWAP from the August 5th lows and should be a significant area for bulls to defend this strong uptrend on the weekly chart which is still intact as prices are now just merely retesting the rising 21 week EMA while sentiment gets flushed out nicely to start the year. A softer start to the year is not always a red flag if the back half of January can rebound and see a bounce stick higher into earnings season which now is the forefront of focus and could actually be a tailwind at these levels. Banks start to report this week followed by larger cap Tech and Discretionary names in the coming weeks. The JPM Healthcare conference this week also can be a catalyst to get Biotech and Pharma names moving higher from recent oversold levels.
Market Sentiment/Breadth
AAII sentiment for the week ending 1/8 showed bullish responses fell to 34.7% from 35.4% prior while bearish responses rose up to 37.4% from 34.2%. Neutral sentiment fell to 28.0% from 30.4%. The bullish reading of 34.7% is the lowest since April 2023. The bull-bear spread (bullish minus bearish sentiment) decreased 4.0 percentage points to –2.7%. The bull-bear spread is below its historical average of 6.5% for the fourth time in seven weeks. The NAAIM Exposure index ticked up to 65.38 from 64.10 last week and is well below last quarter’s Q4 average of 85.81. Total equity fund flows for the week ending 12/31 had $-6 billion in outflows in equities. Friday’s close saw NYSE new highs at 29, while new lows of 233 and the 10-day MA of New High/Low Differential is negative at -63. The percentage of SPX stocks above their 50-MA is at 17.2% and getting under the 20% mark is often a bottoming signal, while those above their 200-MA was 50.8%. NYSI Summation index is below its 8-MA for a short-term bearish signal. NYMO McClellan Oscillator closed at -37 and is falling below Neutral. The cumulative AD line is below the 40 EMA short term breadth trend and closed below the 89 EMA long term bull signal. CBOE Equity P/C 50-day MA is at 0.56. CNN Fear and Greed index is in the Fear zone at 27 from 32 last week. The VIX/VXV ratio closed at 0.93. This measures the spread between 1- and 3-month implied volatility, above 1.0 shows fear and can mark a low.