Weekly Market View 3-30-25
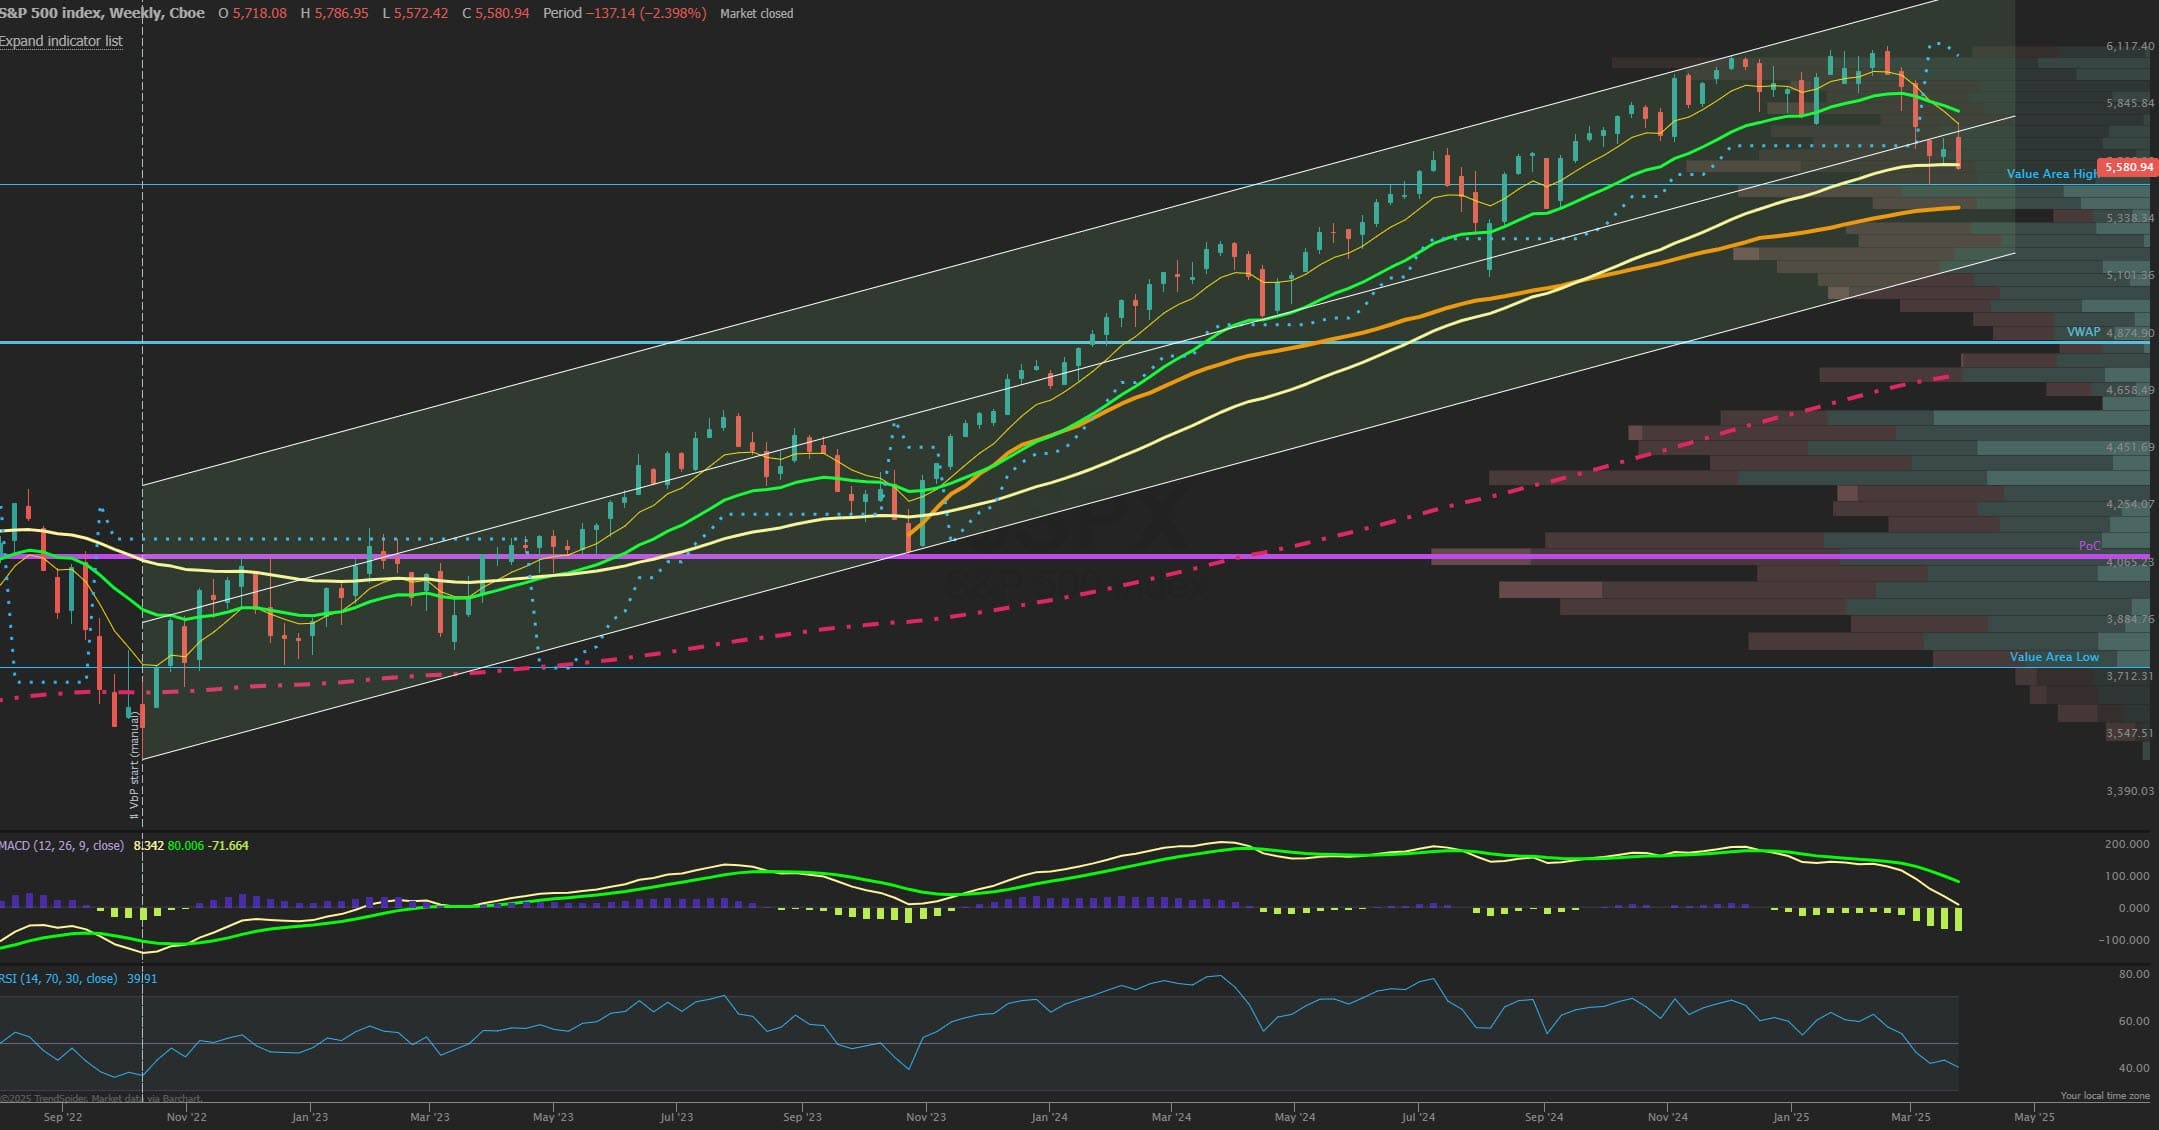
The SPX closed lower for the week by -1.6% after being up over 2% early in the week but seeing that resistance target of 5725 hold for now as expected on the retracement rally the past two weeks. End of quarter sell pressure came in right on schedule and nearly retested the JPM collar strike of 5565 Friday which should be a key level going into Monday as a lot of sticky gamma will be present until the quarterly adjustment later in the day removes that magnet. Overall prices just retesting the lower range of the past few weeks while staying near the 55 week EMA. The market now heads into a more favorable seasonal window of strength in April that is often even stronger in post-election years so the end of quarter selling could setup a stronger rally higher with sentiment about as low as it gets and new quarter money flows potentially sparking upside short covering after the April 2nd tariff day passes. Implied vol’s are higher for April 2nd and any clarity or tariff deal could crush the VIX especially after payrolls data is released this Friday as well. The 5565 JPM collar strike is a long put so option dealers are short that strike and likely will defend that area Monday so any weakness early may revert back up to that strike or higher. Next support this week could come in at 5500 and 5425.
Market Sentiment/Breadth
AAII sentiment for the week ending 3/26 showed bullish responses tick up to 27.4% from 21.6% prior while bearish responses fell to 52.2% from 58.1%. Neutral sentiment moved to 20.4% from 20.3%. The bull-bear spread (bullish minus bearish sentiment) increased 11.8 percentage points to –24.7%. The bull-bear spread is below its historical average of 6.5% for the 12th time in 14 weeks. The NAAIM Exposure index fell to 57.55 from 64.64 last week and is below last quarter’s Q4 average of 85.81 and now back to the August 2024 lows that marked a bottom. Total equity fund flows for the week ending 3/19 had $-10.7 billion in outflows in equities. Friday’s close saw NYSE new highs at 40, while new lows of 137 and the 10-day MA of New High/Low Differential is negative at -18 but rising. The percentage of SPX stocks above their 50-MA is 35.2% while those above 200-MA was 42.8%. NYSI Summation index after crossing higher is fading back below its 8-MA for a short-term bearish signal. NYMO McClellan Oscillator closed at -33 and is lower end of Neutral. The cumulative AD line is below the 40 EMA short term breadth trend and just below the 89 EMA long term bull signal. CBOE Equity P/C 50-day MA is at 0.59. CNN Fear and Greed index is in Extreme Fear zone at 22 from 25 last week. The VIX/VXV ratio closed at 0.98 and was near an extreme. This measures the spread between 1- and 3-month implied volatility, above 1.0 shows fear and can mark a low.