Weekly Market View 4-6-25
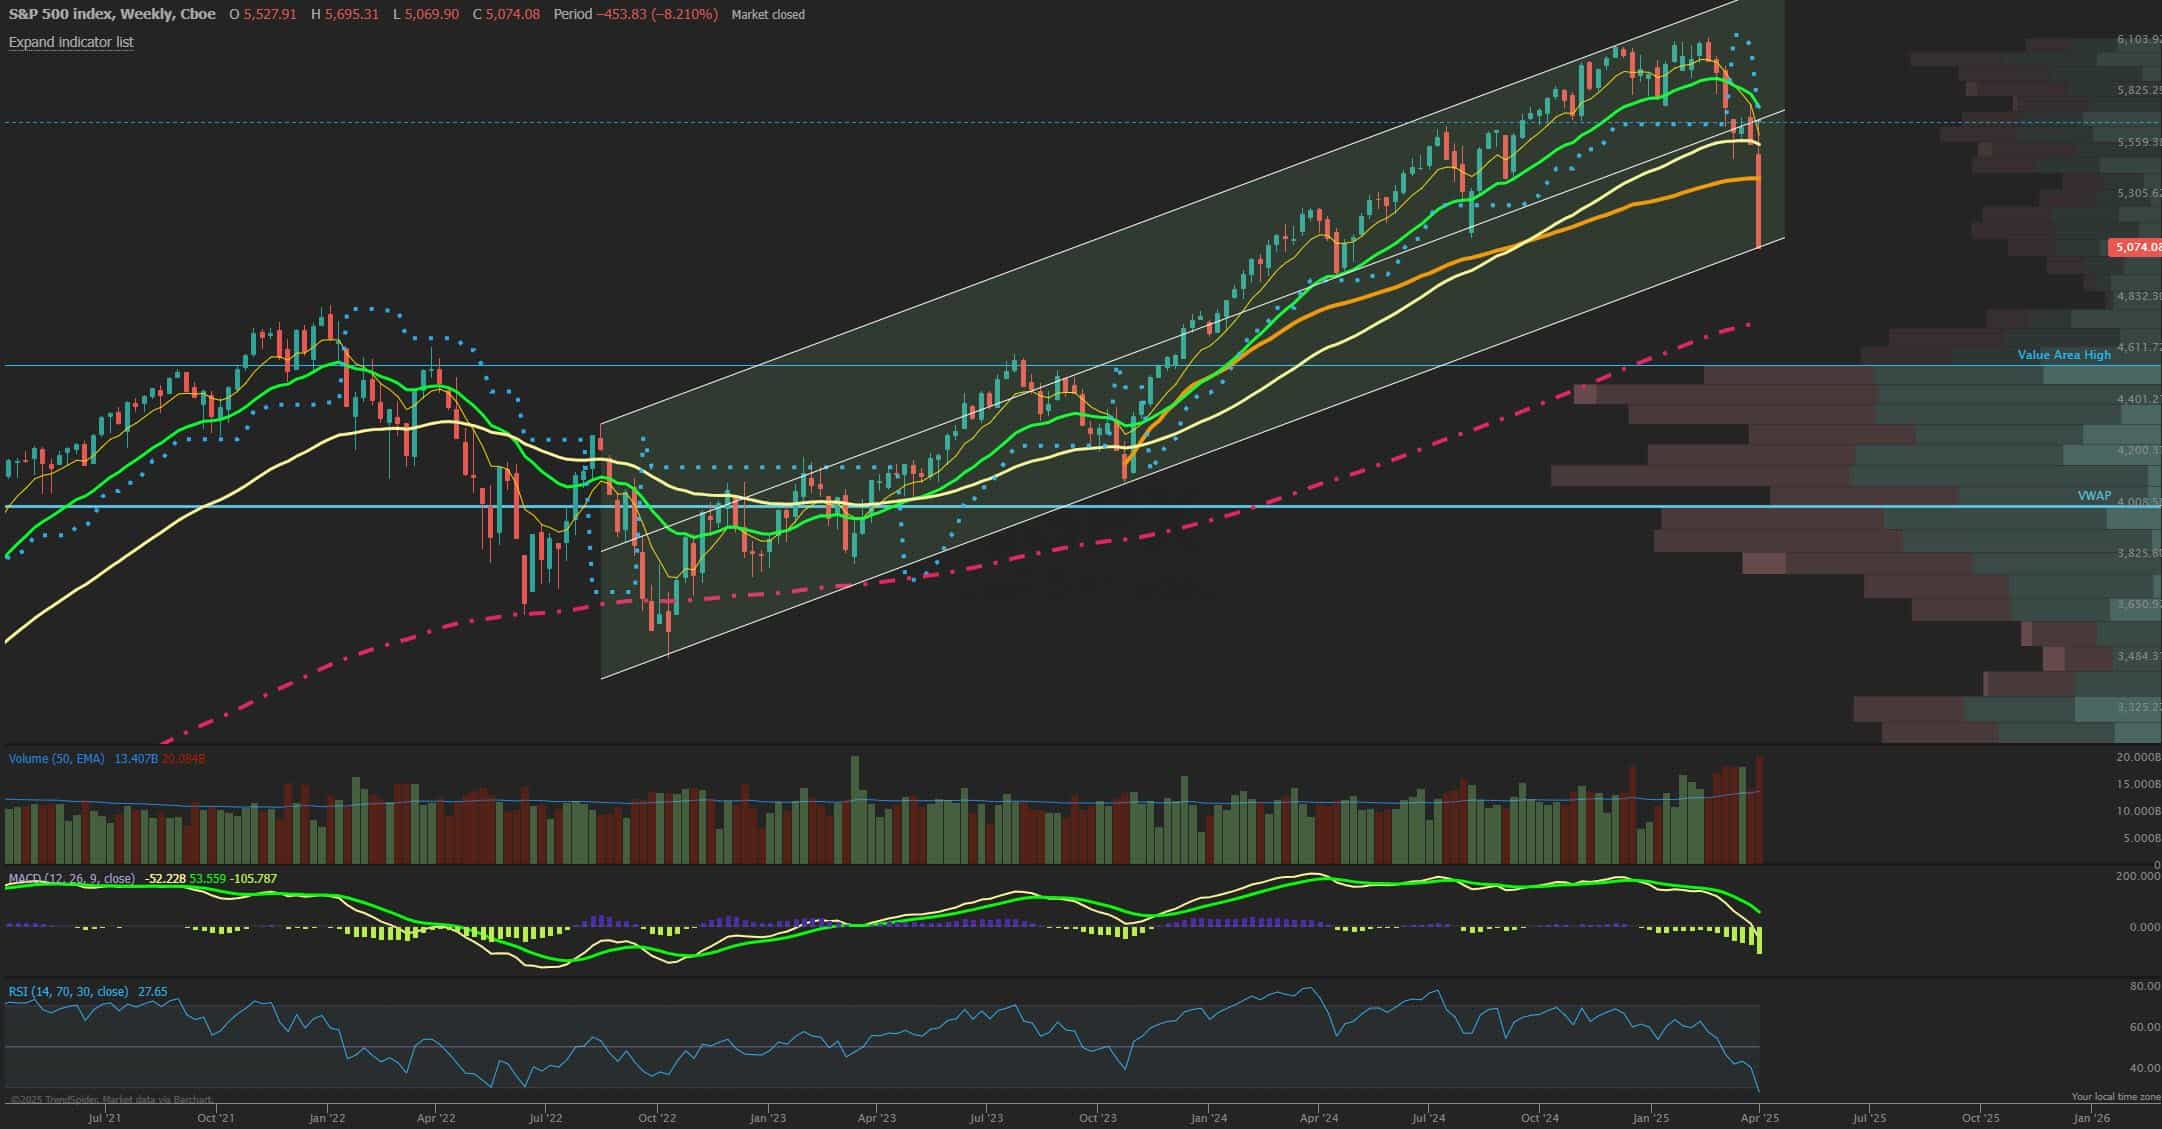
The SPX closed sharply lower for the week as prices exhibited a violent crash after the Wednesday tariff news confirmed the market’s worst fears and once the SPX breached the weeks lower bound of expected move implied by the options market, dealers were forced to sell lower and combined with funds seeing margin calls ended up with a -9% loss for the week. Clearly the largest down move since the 2020 Covid crash and in a liquidation type panic, technical levels matter far less. However, with the market closing at 5075 it puts the massive 5000 round number support level in play for Monday potentially to find a violent snapback. The 5000 SPX level is not just a round number but very large gamma and open interest-based support that would see dealers needing to buy which in turn would likely stabilize prices. The gap that was created from Thursdays close near 5400 would be the first resistance target if the market chose to snapback higher while the 8 EMA currently sits much higher at 5480. A market move like this led by sustained bids in implied volatility, or VIX need to see the first signs of hedges being closed which would allow VIX pressure to ease and thereby deflate implied volatilities and lead to a retracement rally. With the VIX closing at 5-year highs near 45 it will clearly need to come back down to under 35 for the first signs of stability and then even more so when it can decline under 30 for clarity. The 42 level in the VIX seen Friday represents a 3 standard deviation move from the mean over the past 35 years (since 1990) which statistically speaking happens less than 1% of the time so a very rare occurrence that is only seen in panic events. Friday’s volume also set records with total options contracts traded over 100 million and QQQ volume at 117 million, the highest since May 2022’s Tech liquidation.
Market Sentiment/Breadth
AAII sentiment for the week ending 4/2 showed bullish responses fell to 21.8% from 27.4% prior while bearish responses jumped to 61.9% from 52.2%. Neutral sentiment moved to 16.3% from 20.4%. Most of this week’s survey responses were captured prior to President Trump’s tariff announcement on Wednesday, April 2. The bull-bear spread (bullish minus bearish sentiment) decreased 15.4 percentage points to –40.2%. The bull-bear spread is below its historical average of 6.5% for the 13th time in 15 weeks. The NAAIM Exposure index fell to 49.37 from 57.55 last week and is below last quarter’s Q4 average of 72.50 and now at one-year lows. Total equity fund flows for the week ending 3/26 had $-6.9 billion in outflows in equities. Friday’s close saw NYSE new highs at 15, while new lows surged to 1042, the highest spike in new lows since the 2022 bottom and the 10-day MA of New High/Low Differential is negative at -205. The percentage of SPX stocks above their 50-MA fell to 13.0% and tends to be near washout bottoms when gets under 10% while those above 200-MA was 23.4%, the lowest since Oct 2023. NYSI Summation index is below its 8-MA for a short-term bearish signal. NYMO McClellan Oscillator closed at -60 and is nearing oversold. The cumulative AD line is below the 40 EMA short term breadth trend and now firmly below the 89 EMA long term bull signal. CBOE Equity P/C 50-day MA is at 0.59. CNN Fear and Greed index is in Extreme Fear zone at 4 from 21 last week. The VIX/VXV ratio closed at 1.23 and the surge clearly at an extreme being the highest since March 2020 Covid panic. This measures the spread between 1- and 3-month implied volatility, above 1.0 shows fear and can mark a low.