Weekly Market View 4-13-25
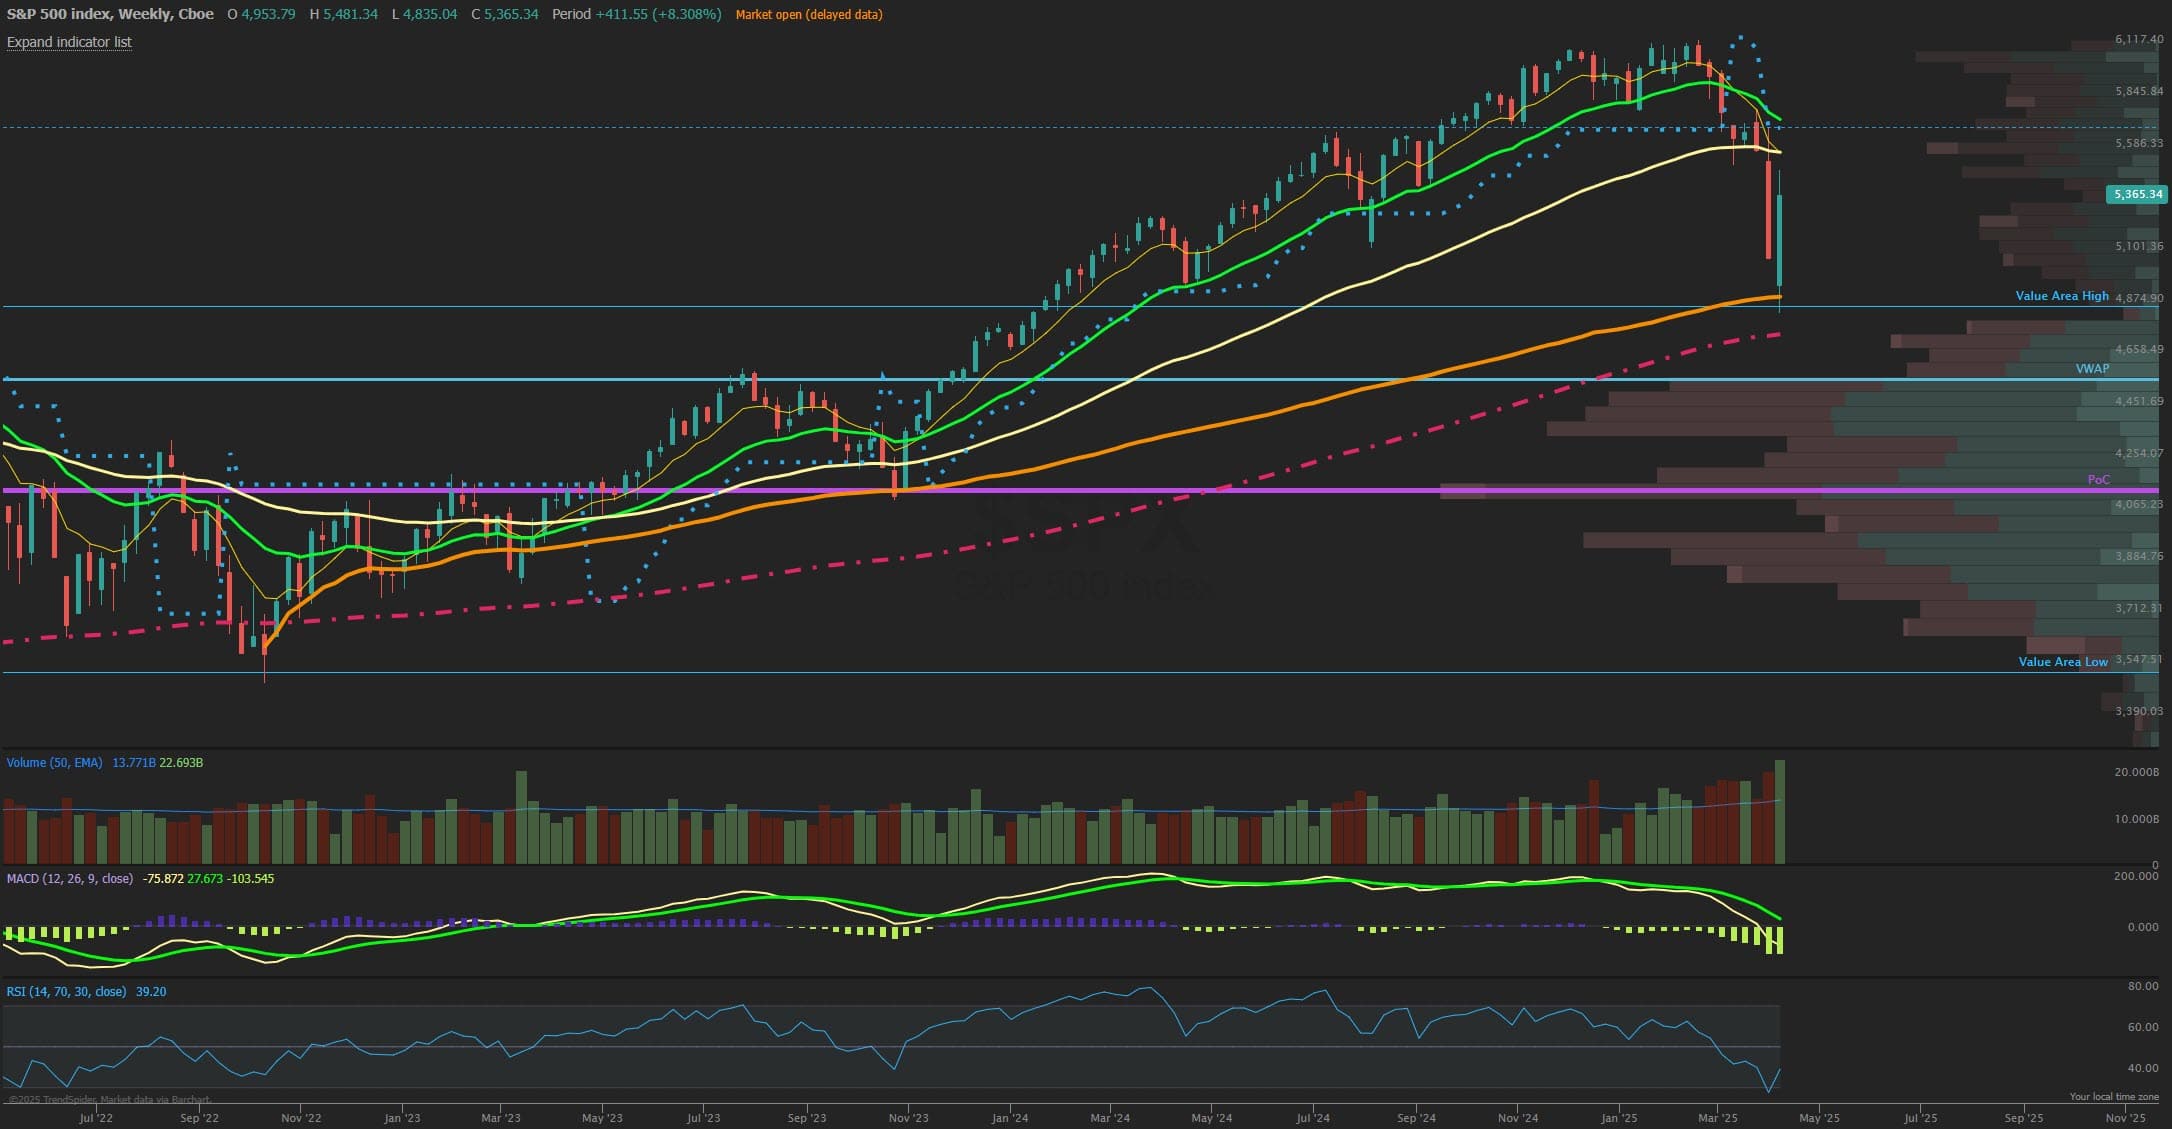
The SPX closed sharply higher on the week by +5.6% from last Fridays close and up over 10% from Mondays opening low as liquidation panic turned into short covering higher in a violent way helped by wildly thin liquidity in the markets allowing for some historic realized volatility intraday with the average true range (ATR) currently over 200 points on the SPX which implies nearly 3.5% daily moves. That is confirmed by the VIX sustaining levels over 35 and although faded somewhat Friday to allow some stability to return, a VIX under 30 seems far-fetched until realized volatility contracts to under 2% moves per day. A new normal of mid 20’s VIX may be in place for now as markets will still have a countdown clock on the 3 month tariff timeframe, barring any resolution to China and US forming a deal. SPX held the large 4800 support level which lined up with its anchored VWAP from the late 2022 lows and the midweek retest near 5000 also saw buyers defend where they needed to while the late week rally now has come back up to 5400 which was a first resistance target for a bounce. Prices could grind up to the 55 week EMA near 5575 from here but likely to see some back-and-forth chop in a volatile range this week as markets have monthly expiration to unwind and a holiday shortened week. A further bounce after OPEX opens the door to some more relief up to the 200 day MA at 5665 currently while support is key to hold at 5150 and for the Nasdaq seeing QQQ hold above 450 would be constructive.
Market Sentiment/Breadth
AAII sentiment for the week ending 4/9 showed bullish responses rose to 28.5% from 21.8% prior while bearish responses fell to 58.9% from 61.9%. Neutral sentiment fell to 12.5% from 16.3%. Neutral sentiment is unusually low and is below its historical average of 31.5% for the 38th time in 40 weeks. Neutral sentiment was last lower on May 28, 2009, (11.0%) and was the 14th-lowest reading in the survey’s history. The bull-bear spread (bullish minus bearish sentiment) increased 9.7 percentage points to –30.4%. The bull-bear spread is below its historical average of 6.5% for the 14th time in 16 weeks. The NAAIM Exposure index rose to 56.96 from 49.37 last week and is below last quarter’s Q4 average of 72.50 after a one-year low last week into the panic but did not quite see the flush to be expected, indicating many likely holding assets although hedged perhaps. Total equity fund flows for the week ending 4/2 had $-15 billion in outflows in equities. Friday’s close saw NYSE new highs at 19, while new lows at 230 and the 10-day MA of New High/Low Differential is negative at -472. The percentage of SPX stocks above their 50-MA is at 20.4% after hitting a low near 6% and tends to be near washout bottoms when they get under 10% while those above 200-MA was 28.8%, the lowest since Oct 2023. NYSI Summation index is below its 8-MA for a short-term bearish signal. NYMO McClellan Oscillator closed at -31 after hitting Oversold at -90. The cumulative AD line is below the 40 EMA short term breadth trend and now firmly below the 89 EMA long term bull signal. CBOE Equity P/C 50-day MA is at 0.61. CNN Fear and Greed index is in Extreme Fear zone at 13 from 4 last week. The VIX/VXV ratio closed at 1.11 and stayed inverted showing caution although well off the high. This measures the spread between 1- and 3-month implied volatility, above 1.0 shows fear and can mark a low.