Weekly Market View 12-10-23
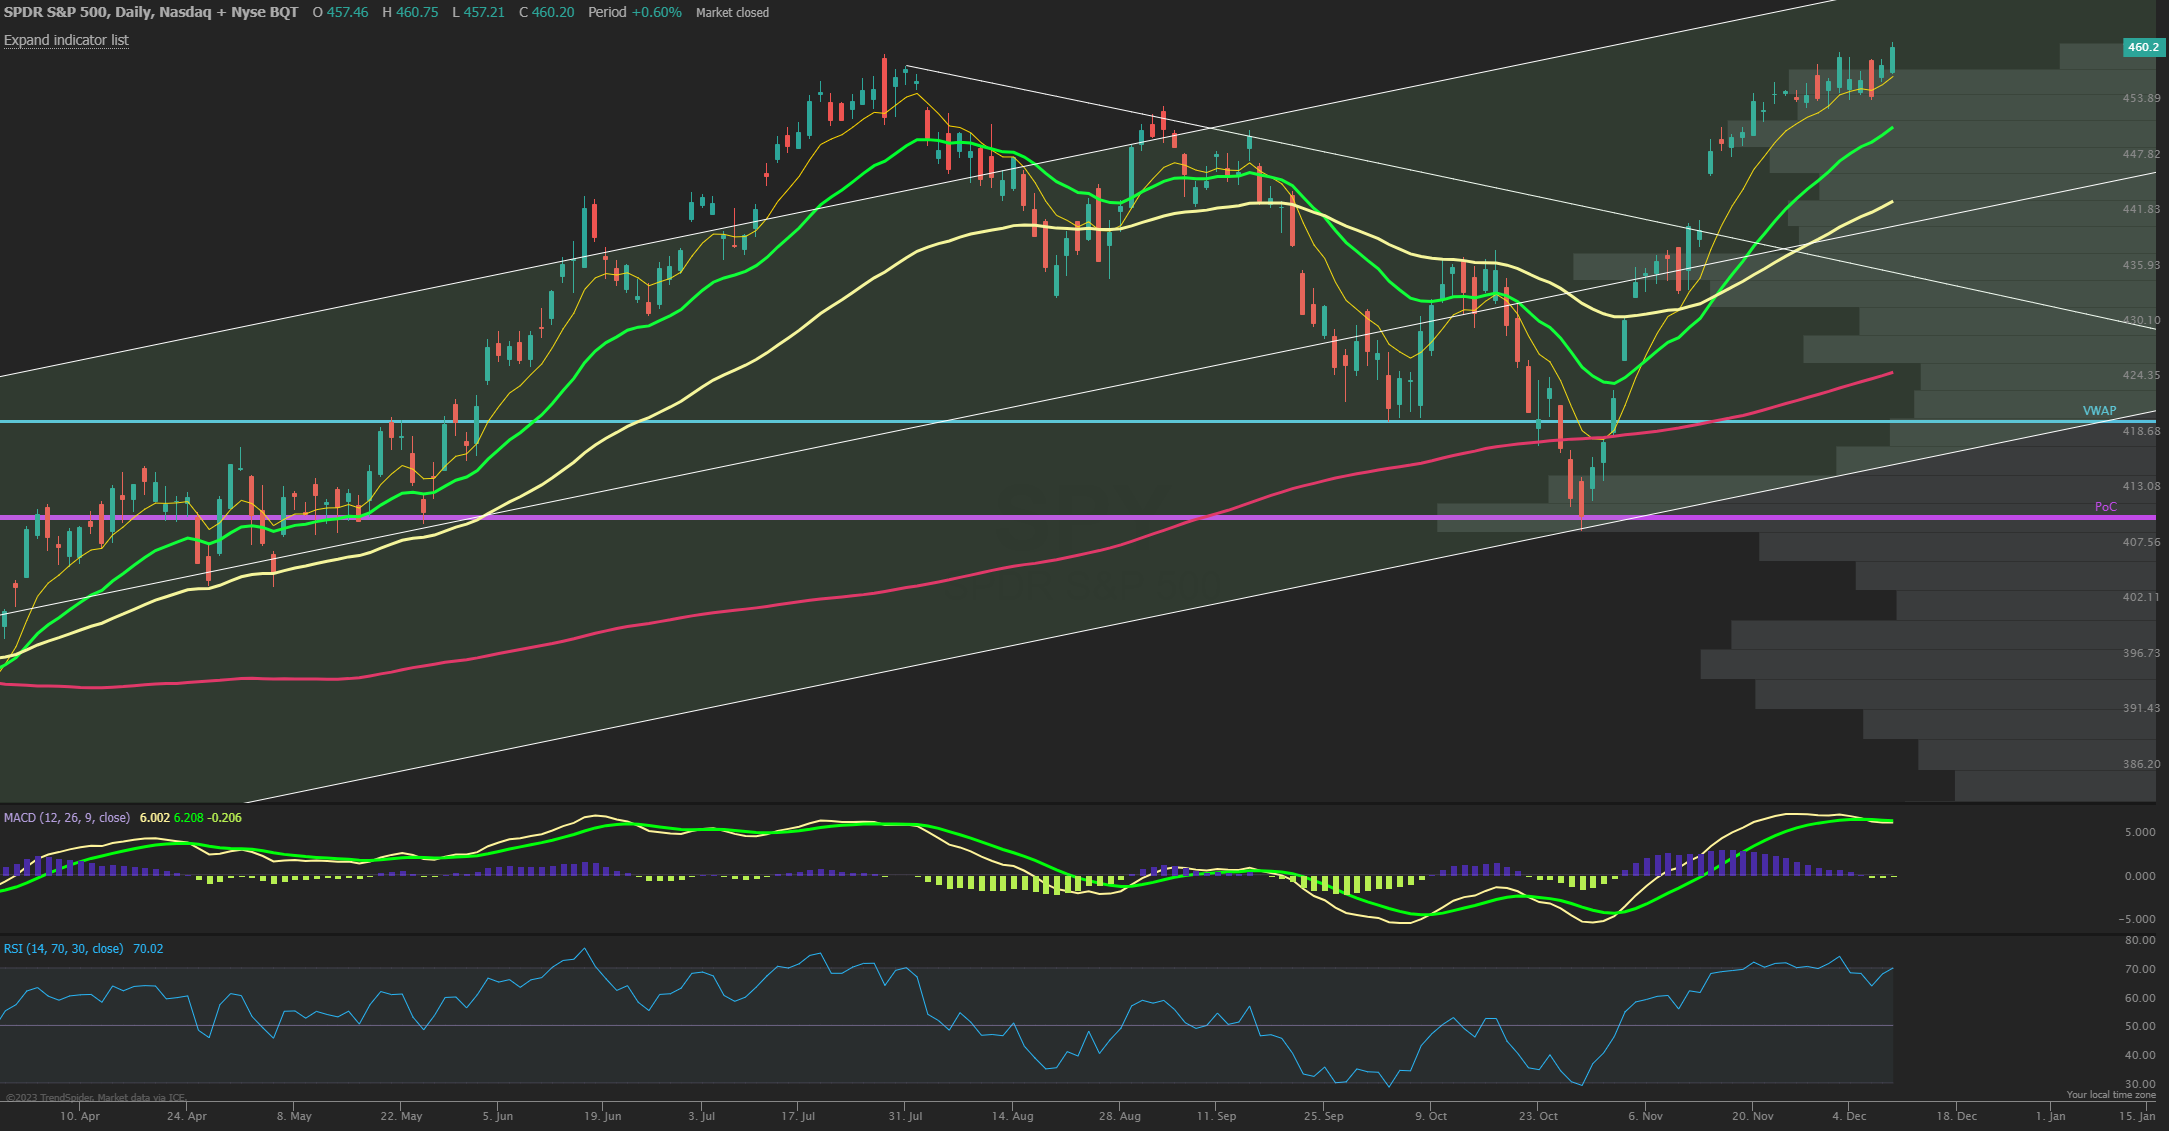
The SPX closed +0.25% eking out a slight gain for the week after the strong Friday rally post Jobs report secured the 6th straight positive week, the first time that has happened since late 2019. SPX closed just above the key 4600 round number level also to finish at the highest closing price since March 2022. The July highs have now been hit in just 6 short weeks that retraced nearly 3 months of that downside correction that bottomed perfectly at long term support. The December triple witching OPEX week now takes hold with a often bullish bias historically and a key FOMC meeting this week pricing in a bit more price range than recently. Support below on any dip comes in at the 8 EMA of 4575 and then the 21 EMA is at 4520 which also likely becomes max downside into the Christmas holiday and slower weeks with the JPM short call strike at 4515 and now a presumably large support floor. Resistance next above would come in at 4650 SPX as a larger gamma node and lines up close to the 1.272 fib extension target of the entire July-Dec range at 4744.

Market Sentiment/Breadth
AAII sentiment for the week ending 12/6 showed bullish responses decreased slightly to 47.3% from 48.8% prior while bearish responses increased to 27.4% from 19.6%. Neutral sentiment fell to 25.3% from 31.7%. Pessimism rebounded from its lowest level in almost six years. Both readings have returned to their respective typical ranges. The bull-bear spread (bullish minus bearish sentiment) decreased 9.3 percentage points to 19.9%. The bull-bear spread is above its historical average of 6.5% for the fifth time in nine weeks. The NAAIM Exposure index decreased to 76.09 from 81.38 and is above last quarter’s average of 60.53 but still not overly extreme. Total equity fund flows (ETF’s and Mutual Funds) for the week ending 11/29 had $+4.3 billion of inflows in equities. Friday’s close saw NYSE new highs at 101 while new lows of 19 and the 10-day MA of New High/Low Differential is positive at +88. The percentage of SPX stocks above their 50-MA is 83.0% while those above their 200-MA was 66.4%. NYSI Summation index is above its 8-MA for a short term buy signal. NYMO McClellan Oscillator closed at +37 and now Neutral. The cumulative AD line is above the 40 EMA short term breadth and firmly above the 89 EMA long term bull signal. CBOE Equity P/C 50-day MA at 0.74. CNN Fear and Greed index is in the Greed zone at 68 from 67 last week. The VIX/VXV ratio closed at 0.815. This measures the spread between 1- and 3-month implied volatility, above 1.0 exhibits fear and tends to mark a low.
