Weekly Market View 3-16-25
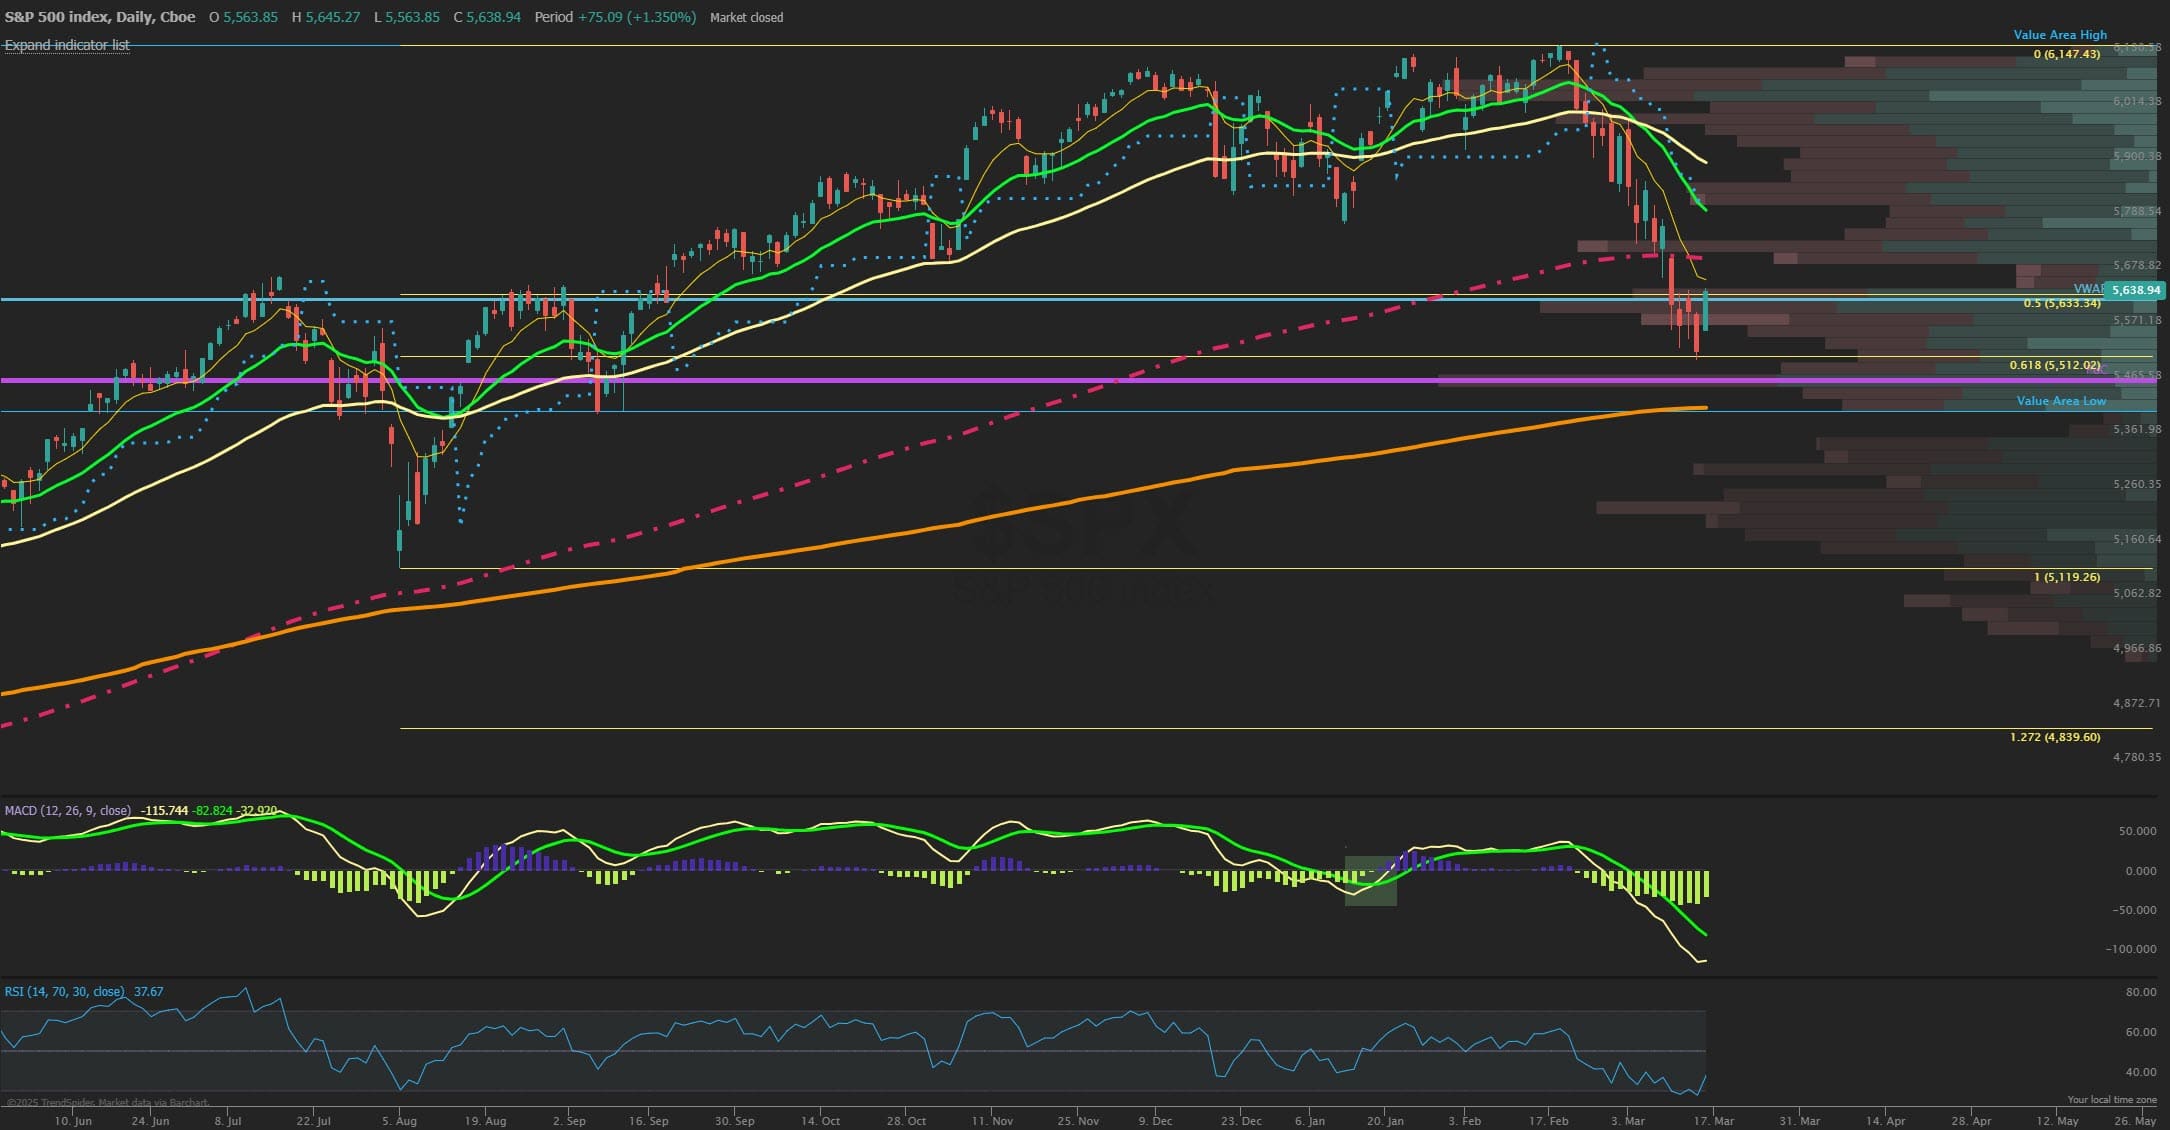
The SPX closed lower on the week by -2.5% but finished with a strong breadth surge higher on Friday as prices held precisely at the 61.8% Fibonacci retracement from the August lows to recent 2025 highs, a key and pivotal area with other metrics like the VIX fading lower suggesting a potentially intermediate bottom was made. Things can change quickly of course but the VIX going lower will be a strong confirmation of follow-through in the cards as March expiration comes this week as well as FOMC midweek. That 61.8% fib level also lined up with the 5500 round number support strike on the SPX which is a large put wall of gamma support. Volatility will still be abound this week as prices are in negative gamma territory but coming off this very oversold condition can see a sharp rebound into March OPEX that has 5700 as a first target up from here and then 21 EMA closer to the 5800 level, which would be 50% retracement of the decline that comes in at 5825. The large March triple witching expiration this week has a seasonal tendency to see bullish bias due to the Vanna and charm flows associated with option dealers buying back their short stock hedges but after this week’s action passes it will be key for markets to continue to improve breadth which will drive the next trend.
Market Sentiment/Breadth
AAII sentiment for the week ending 3/12 showed bullish responses tick down to 19.1% from 19.3% prior while bearish responses rose to 59.2% from 57.1%. Neutral sentiment fell to 21.7% from 23.6%. Bullish sentiment was last lower on September 22, 2022 (17.7%). This is the first time that bullish sentiment has been below 20% for three straight weeks. The bull-bear spread (bullish minus bearish sentiment) decreased 2.3 percentage points to –40.1%. The NAAIM Exposure index fell to 68.80 from 74.96 last week and is below last quarter’s Q4 average of 85.81 and getting back down to lower levels but still not quite to the summer 2024 lows of 56. Total equity fund flows for the week ending 3/5 had $-16.9 billion in outflows in equities. Friday’s close saw NYSE new highs at 32, while new lows of 61 and the 10-day MA of New High/Low Differential is negative at -103. The percentage of SPX stocks above their 50-MA is 34.2% while those above 200-MA was 40.6%. NYSI Summation index is below its 8-MA for a short-term bearish signal. NYMO McClellan Oscillator closed at -14 after hitting near -60 and is back to Neutral. The cumulative AD line is below the 40 EMA short term breadth trend although rebounded hard Friday and just below the 89 EMA long term bull signal. CBOE Equity P/C 50-day MA is at 0.57. CNN Fear and Greed index is in Extreme Fear zone at 21 from 18 last week. The VIX/VXV ratio closed at 0.98 and fell from extreme highs this week, which is often seen near a market bottom. This measures the spread between 1- and 3-month implied volatility, above 1.0 shows fear and can mark a low.