Weekly Market View 3-31-24
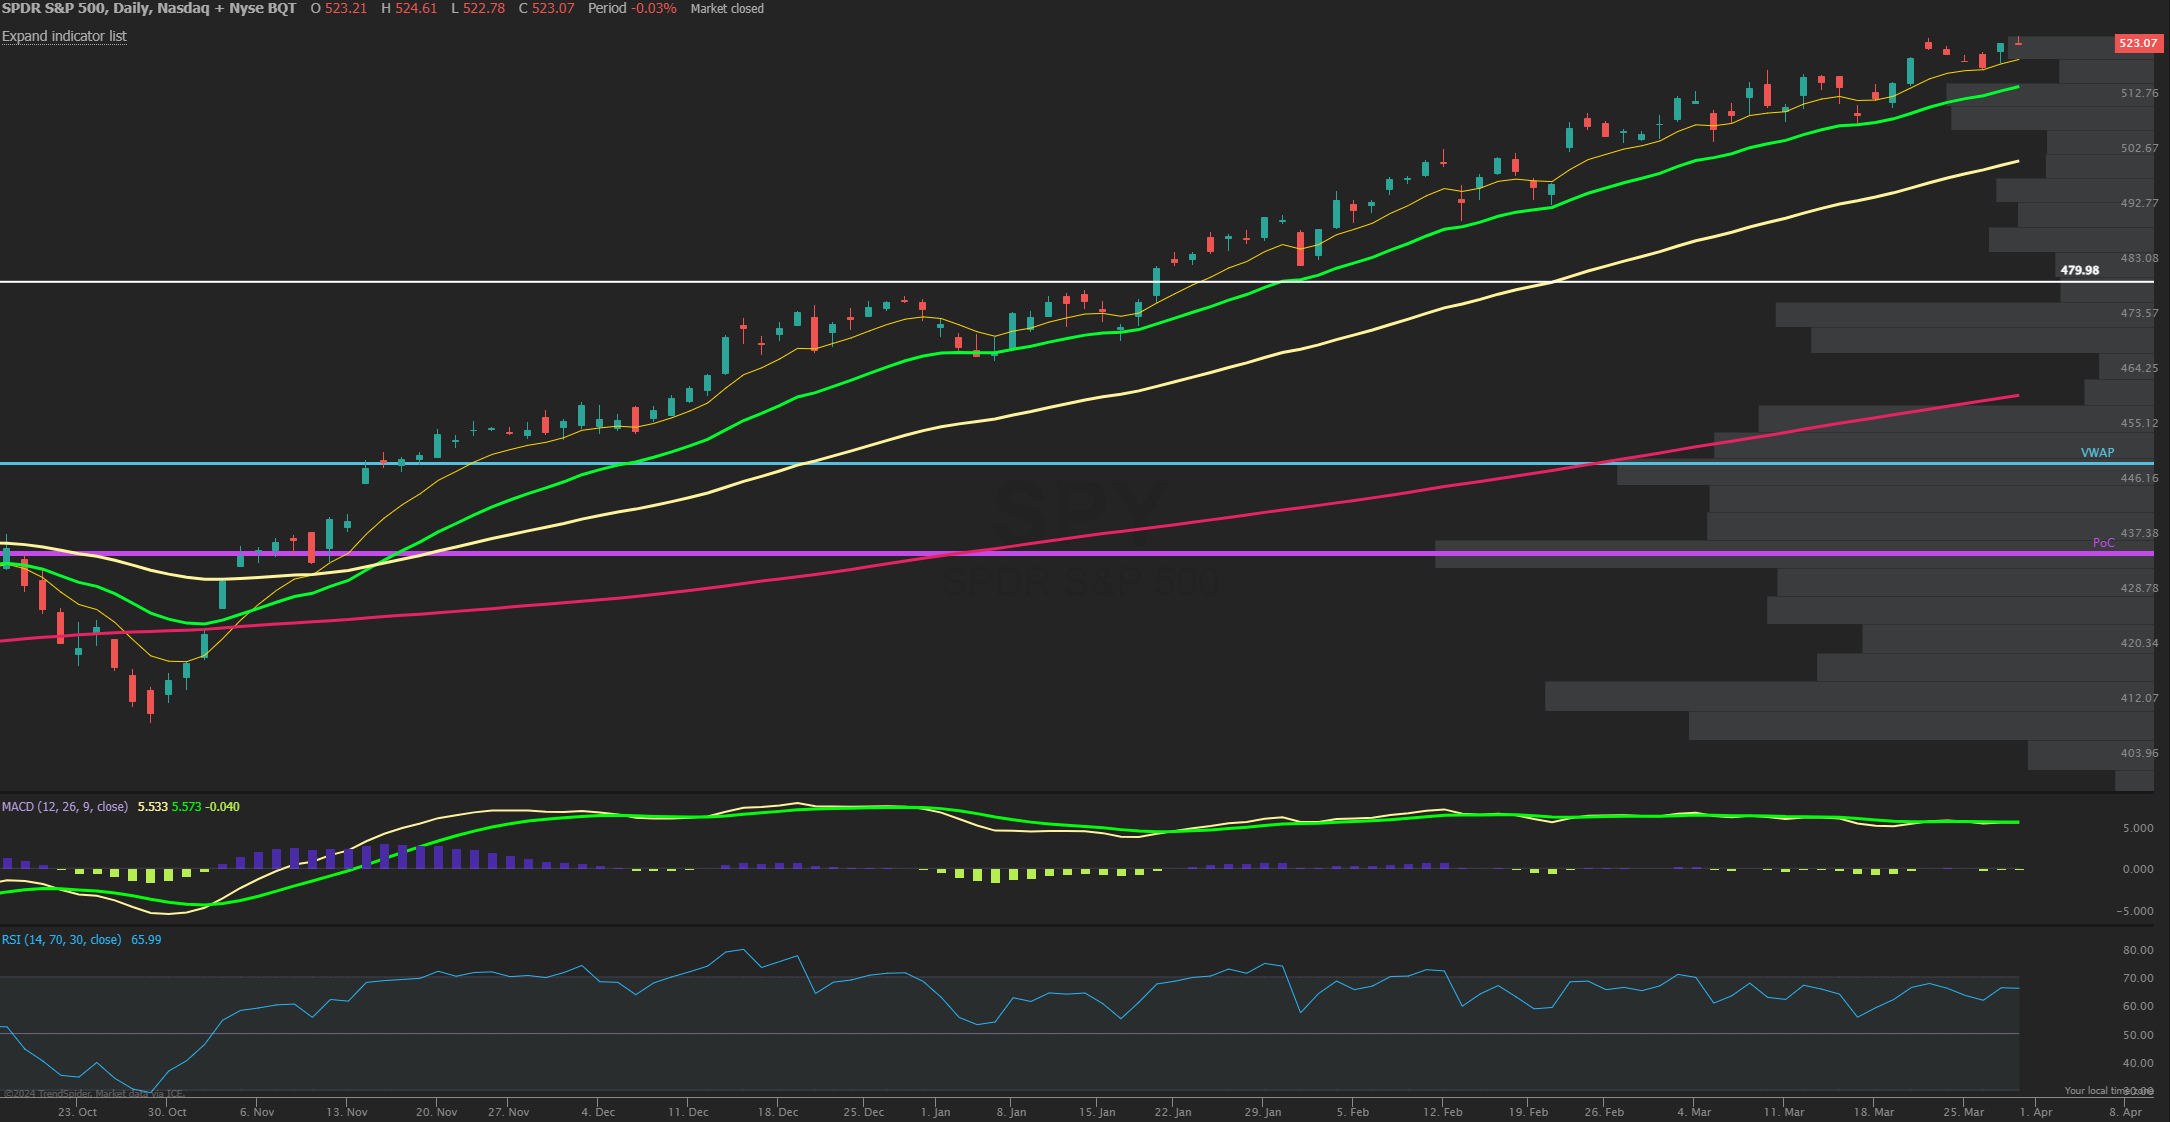
The SPX closed a quiet holiday shortened week up marginally by 20 points on the week after an early week dip held the 8 EMA support near 5200. Not much has changed the past week in regard to key levels which remain 5250 resistance on the upside and then 5300 the next gamma wall while if 5200 breaks lower then it is likely to see a swift retest of 5160 where the 21 EMA sits near a thick zone of volume support. The weekly expected move was a narrow one last week and this week is pricing in a bit larger range with SPX implied move of +/- 55 points. The sector rotation that was seen was the more interesting angle as small cap stocks outperformed strongly with the IWM +2.6% on the week while the Nasdaq QQQ was lower by -0.6%. This may have just been the end of quarter rebalancing but also could be a preview of Q2 rotations into more undervalued groups. The leading sectors for the week were Utilities, Energy and Healthcare with Tech and Discretionary both softer. The bond market also showed strength again back above the 50- and 200-day MA’s on the TLT as it continues to coil at this one year POC level of 94 amid a lot of bearish sentiment in bonds which continue to look more bullish along with gold and crude oil breaking out strongly to highs. Not to say stocks can’t move in sympathy with all these other asset classes but sometimes can be warning signs of rotation in safer havens. For now, SPY has support at 520 and then 515 near the 21-day EMA where it has held above since late January.
Market Sentiment/Breadth
AAII sentiment for the week ending 3/27 showed bullish responses rise to 50.0% from 43.2% prior while bearish responses decreased to 22.4% from 27.2%. Neutral sentiment fell to 27.6% from 29.6%. The bull-bear spread (bullish minus bearish sentiment) increased 11.5 percentage points to 27.6%. The bull-bear spread is above its historical average of 6.5% for the 21st consecutive week. The NAAIM Exposure index increased to 103.88 from 93.22 last week and is still well above last quarter’s average of 67.81. Total equity fund flows for the week ending 3/20 had $-3.9 billion of outflows in equities. Friday’s close saw NYSE new highs at 370 while new lows of 12 and the 10-day MA of New High/Low Differential is still positive at +77. The percentage of SPX stocks above their 50-MA is at 85.2% while those above their 200-MA was 85.8%. NYSI Summation index remains above its 8-MA for a short term buy signal. NYMO McClellan Oscillator closed at +25 and Neutral. The cumulative AD line increased this week and is still well above the 40 EMA short term breadth and above the 89 EMA long term bull signal. CBOE Equity P/C 50-day MA at 0.63. CNN Fear and Greed index is in the Greed zone at 71 from 72 last week. The VIX/VXV ratio closed at 0.856. This measures the spread between 1- and 3-month implied volatility, above 1.0 exhibits fear and tends to mark a low.