Weekly Market View 4-20-25
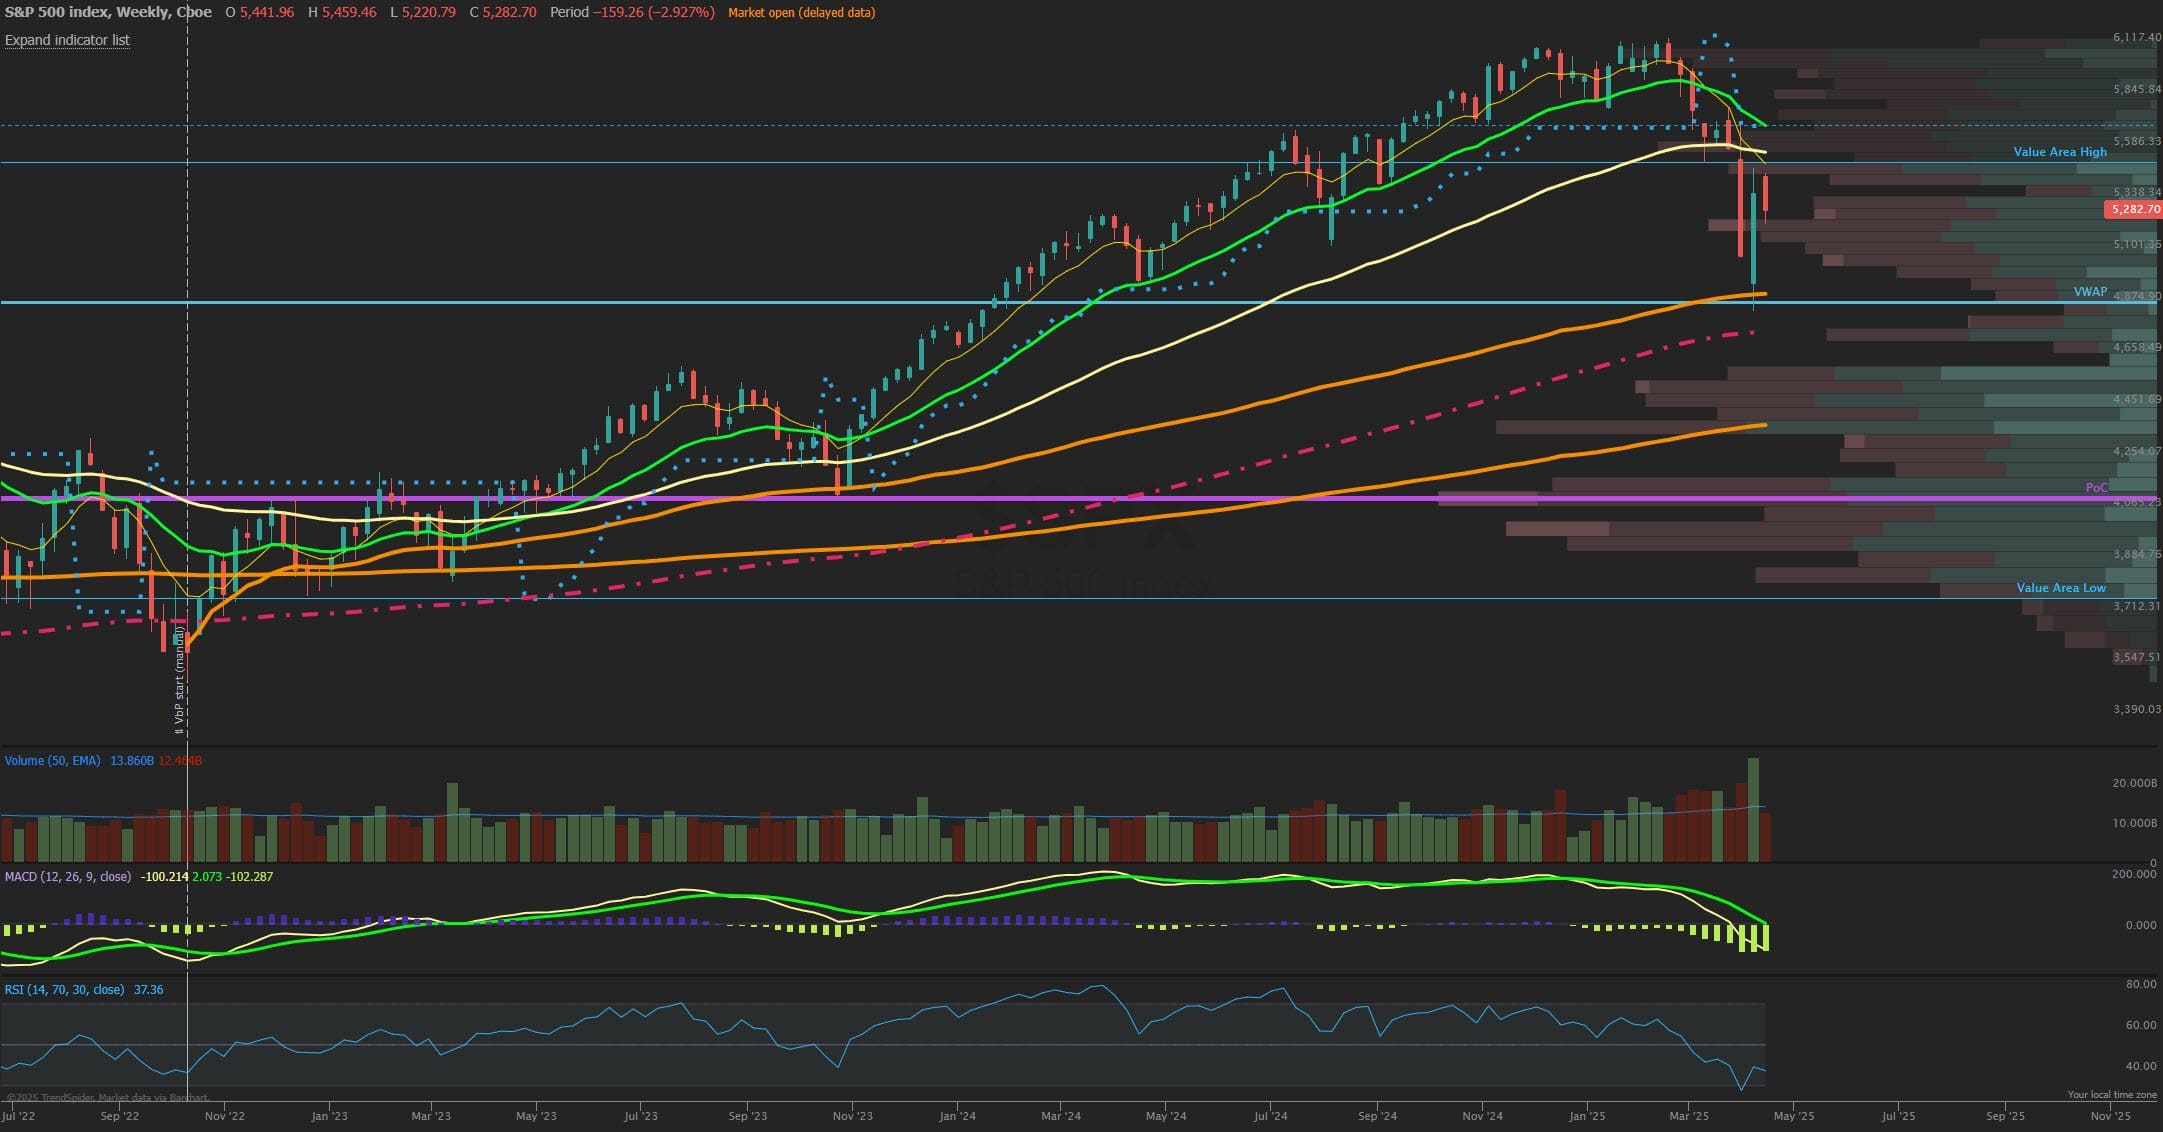
The SPX closed slightly lower on the week but printed an inside candle for the weekly chart, unsurprisingly with last week’s wildly large range almost certainly was due to see some reversion in volatility this week into options expiration as we noted last week. With the VIX coming back to the 30 level and the easy technical bounce on SPX reaching the 5450 level, now markets head into the bulk of earnings season that should be a key driver for risk on/off appetite. Risks of volatile ranges still exist with negative gamma in the SPX complex and the VIX future curve mildly inverted still but breadth has improved enough to likely make those panic lows under 5000 secure for now. Although retests of the 5000 level could occur from here, that is a strong support zone based on volume profile and open interest positioning. 5200 is a secondary support closer to current prices that held firm this week with the low being 5220. A continued choppy rangebound market seems most likely from here into month end but with the latter half of April often being more bullish seasonally and sentiment at multi year lows now it may open the door to a retest of the 5550 level which is near the 55 day EMA and lines up with one year value area high on the profile.
Market Sentiment/Breadth
AAII sentiment for the week ending 4/16 showed bullish responses fall to 25.4% from 28.5% prior while bearish responses fell to 56.9% from 58.9%. Neutral sentiment rose to 17.7% from 12.5%. Bearish sentiment has now been above 50% for eight consecutive weeks, the longest period over 50% in the survey’s history. The bull-bear spread (bullish minus bearish sentiment) decreased 1.0 percentage points to –31.4%. The bull-bear spread is below its historical average of 6.5% for the 15th time in 17 weeks. The NAAIM Exposure index fell sharply to 35.16 from 56.96 last week and is well below last quarter’s Q4 average of 72.50. This is the lowest reading for NAAIM since the October 2023 bottom. Total equity fund flows for the week ending 4/9 had $-6.6 billion in outflows in equities. The prior day’s close saw NYSE new highs at 14, while new lows dropped substantially now at 40 and the 10-day MA of New High/Low Differential is negative at -391. The percentage of SPX stocks above their 50-MA is at 24.6% after hitting a low near 6% and tends to be near washout bottoms when they get under 10% while those above 200-MA was 32.0%. NYSI Summation index is crossing higher and nearly above its 8-MA for a short-term bullish signal. NYMO McClellan Oscillator closed at +30 after rebounding back to bullish neutral. The cumulative AD line bounced but is below the 40 EMA short term breadth trend and below the 89 EMA long term bull signal. CBOE Equity P/C 50-day MA is at 0.62. CNN Fear and Greed index is in Extreme Fear zone at 21 from 13 last week. The VIX/VXV ratio closed at 1.01 and nearly back under the key 1.0 level but still showing some caution. This measures the spread between 1- and 3-month implied volatility, above 1.0 shows fear and can mark a low.