Weekly Market View 4-27-25
Technical Market View
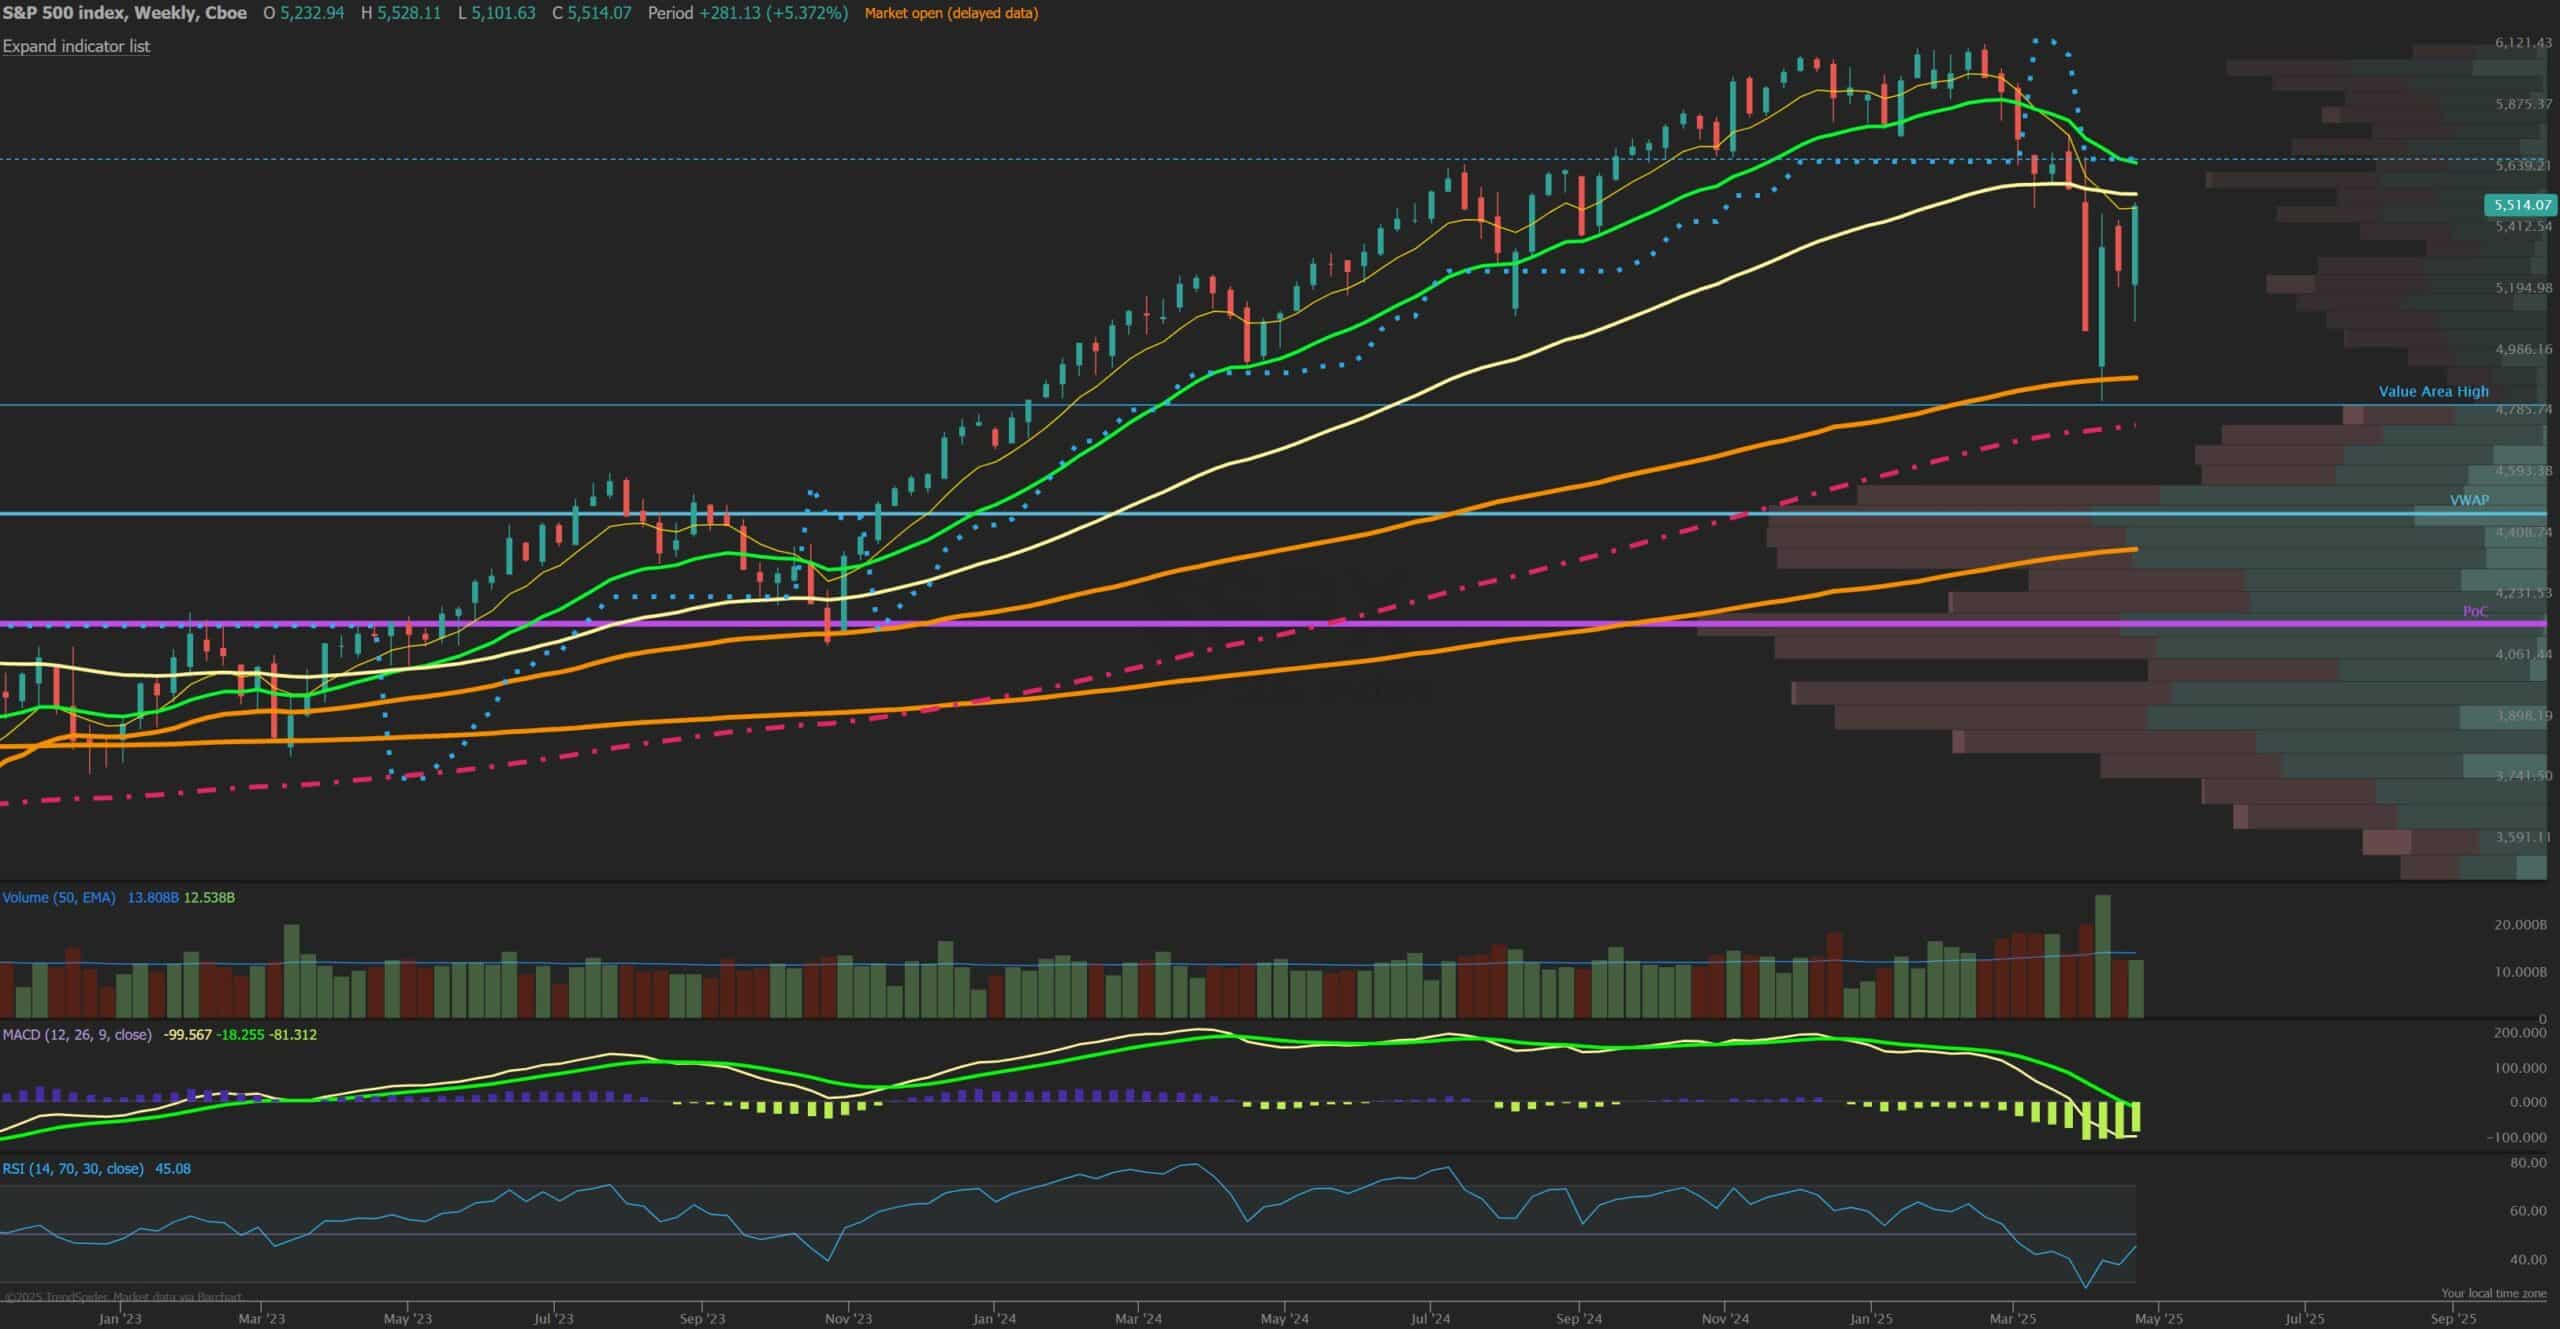
The SPX closed strongly higher for the week after starting Monday on a soft note but that early week dip was not marked by any real bid in volatility as VIX stayed contained. The market saw a surge in breadth higher the rest of the week with impressive power and resilience especially by Thursday and Friday as the rare but reliable ‘Zweig Breadth Thrust’ confirmed right as the SPX closed above 5500 to hold firm and print a bullish engulfing weekly candle, often one of the best signals from a medium term timeframe when coming off a higher low retest as the SPX just did. The breadth thrust is a strong signal that has only occurred a handful of times in the past 10 years and measures the ratio of advancing to declining stocks and identifying when this ratio increases significantly within a short period, signifying the end of a bearish period under the hood of the markets internal health. Looking at the levels of interest shorter the SPX is overbought with the NYMO extended and prices right into the big zone near the 55 EMA and prior breakdown level of 5600 so a potential pullback into the final three days of April would not be surprising but indicators now on buy the dip signals so support comes in at 5425 where the 8/21 EMA’s are converging and nearing a bull cross. Below that would be a gap fill at 5300 but that gap from last week feels like it may be one that’s holds for now as many expected it to fade but buyers remained in control into Friday. A stronger rally would target the 200 day EMA above at 5640.
Market Sentiment/Breadth
AAII sentiment for the week ending 4/23 showed bullish responses fell to 21.9% from 25.4% prior while bearish responses fell to 55.6% from 56.9% but stayed unusually high. Neutral sentiment rose to 22.5% from 17.7%. Bearish sentiment has now been above 50% for nine consecutive weeks, the longest period over 50% in the survey’s history. The bull-bear spread (bullish minus bearish sentiment) decreased 2.2 percentage points to –33.6%. The bull-bear spread is below –20.0% for the ninth consecutive week. This is the longest streak below –20.0% since a 12-week stretch between September 14 and November 30, 1990. The NAAIM Exposure index ticked up slightly to 40.67 from 35.16 last week and is well below last quarter’s Q4 average of 72.50. This is abnormally low and near extremes still with the market bounce. Total equity fund flows for the week ending 4/16 had $-7.7 billion in outflows in equities. The prior day’s close saw NYSE new highs at 23, while new lows at just 14 and the 10-day MA of New High/Low Differential is rebounding fast at -33. The percentage of SPX stocks above their 50-MA is at 32.8% after hitting a low near 6% and tends to be near washout bottoms when they get under 10% while those above 200-MA was 34.8%. NYSI Summation index is now firmly above its 8-MA for a short-term bullish signal. NYMO McClellan Oscillator closed at +80 and now Overbought short term. The cumulative AD line surged higher above the 40 EMA short term breadth trend and now above the 89 EMA long term bull signal showing the recent bottom is likely secure. CBOE Equity P/C 50-day MA is at 0.62. CNN Fear and Greed index is in Fear zone at 35 from 19 last week. The VIX/VXV ratio closed at 0.98 and now slightly under the key 1.0 level of inversion. This measures the spread between 1- and 3-month implied volatility, above 1.0 shows fear and can mark a low.