Weekly Market View 4-9-2023
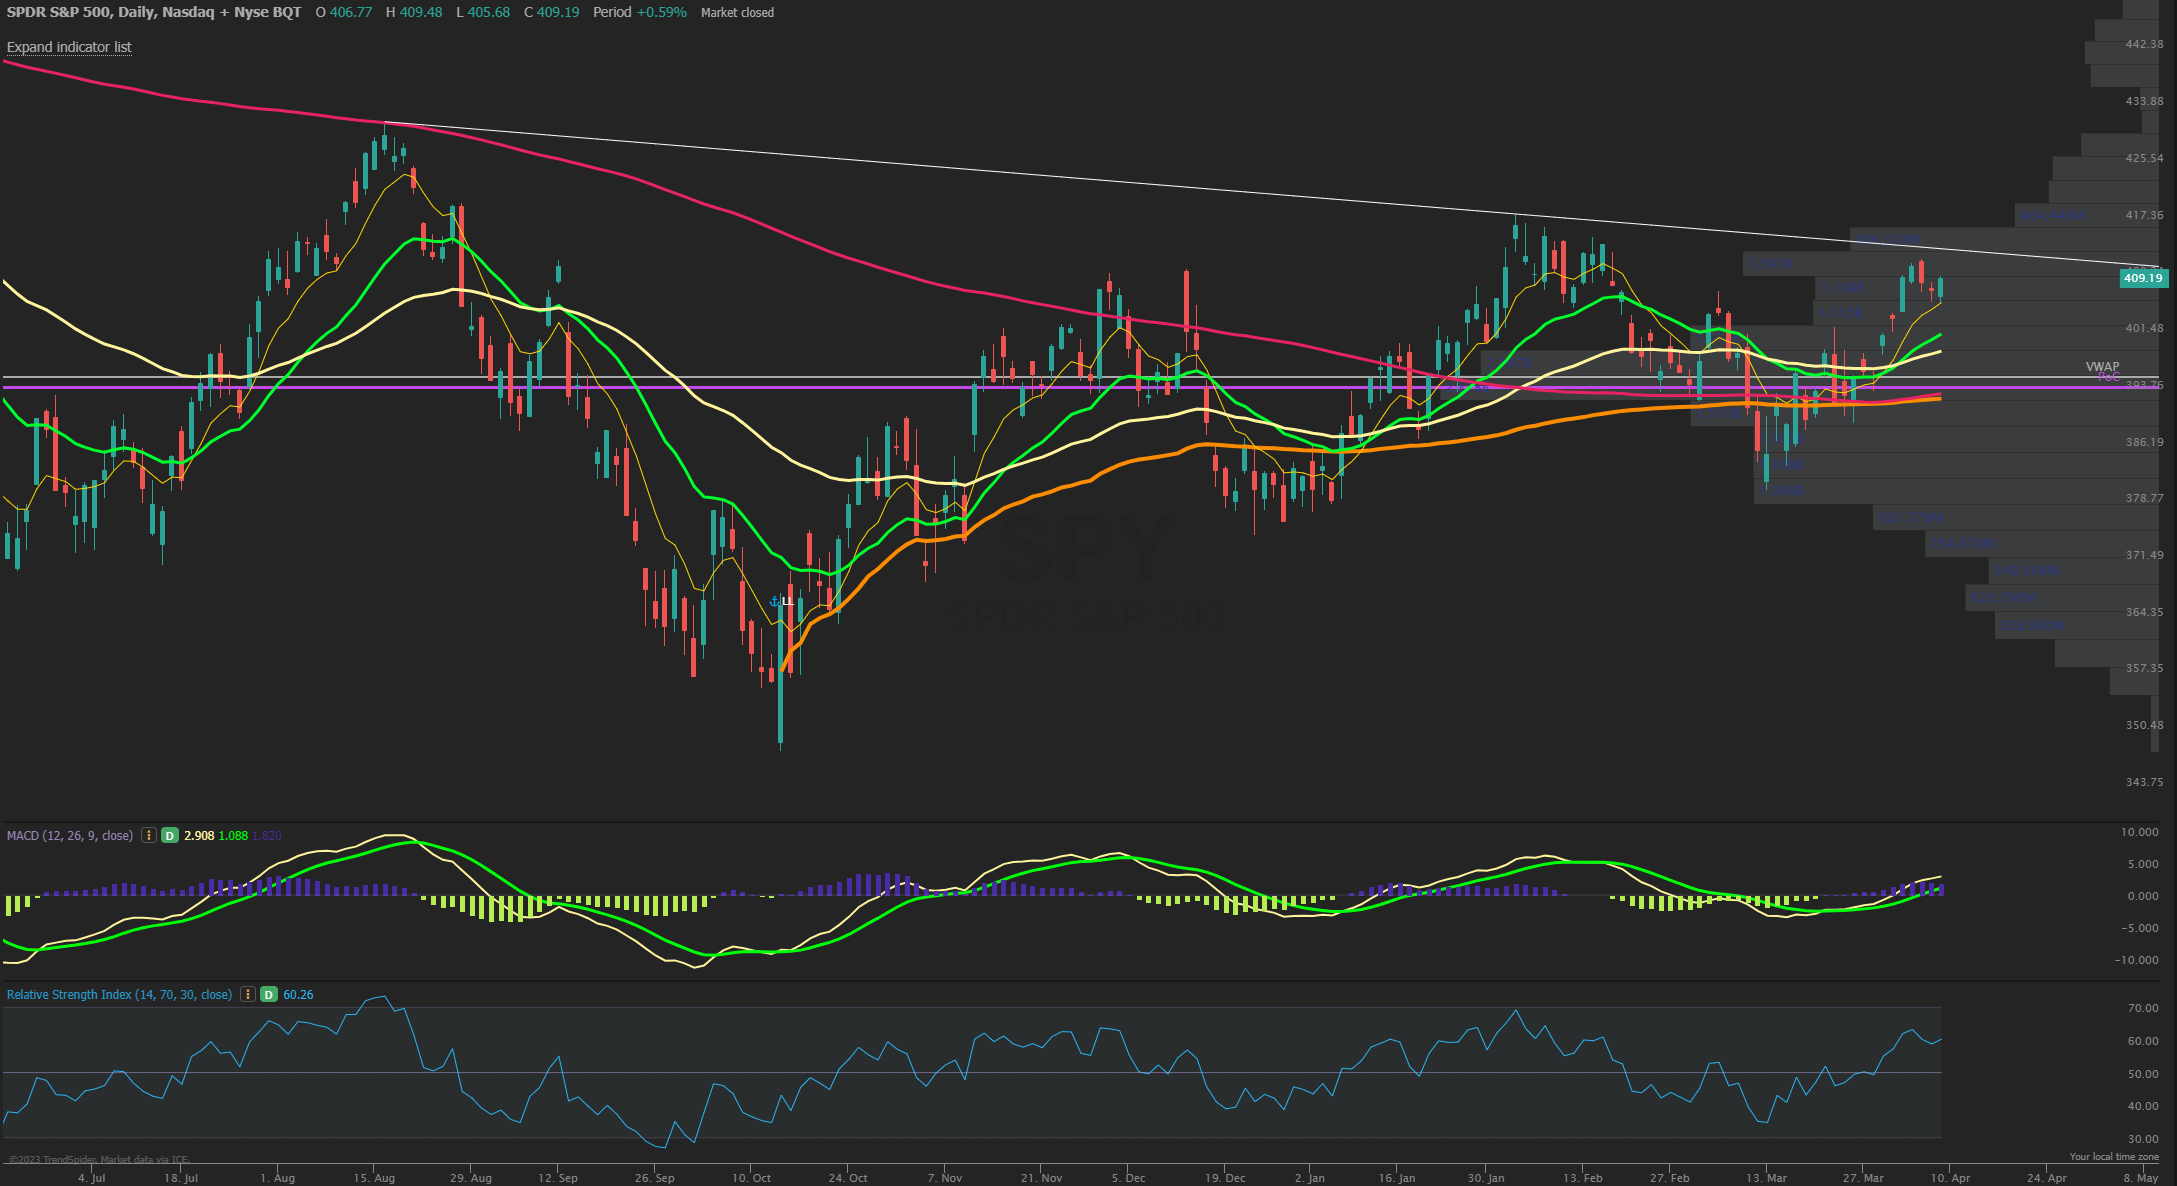
The SPX closed the shortened week on a strong note moving to higher to finish the week flat overall after the early week dip was bought near 4070 at the 8 EMA as the recent uptrend tries to extend while the different indices remain bifurcated with the Nasdaq stronger and the Russell Small Caps much weaker. All this likely points to a more rangebound overall tape into April versus a clean uptrend if all indices were in sync. Technically the SPY volume profile below has room to still fill in space lower to 4205-4050 if the pullback persists back to the stronger support of the 21 EMA. The trendline from the August highs is now directly above prices here at near 413 so a close above that SPY level would open a move to 420 or roughly 4200 on the SPX which would likely be a stronger ceiling in the short term. RSI and MACD remain on a buy signal and the former not yet overbought as it was at the February highs near a 70 reading.
Market Sentiment/Breadth
AAII sentiment for the week ending 4/5 showed bullish responses rise to 33.3% from 22.5% prior while bearish responses fell to 35.0% from 45.6%. Neutral sentiment was flat to 31.6% from 31.9%. Pessimism among individual investors decreased but remained above average for the seventh consecutive week. The bull-bear spread (bullish minus bearish sentiment) increased 21.4 percentage points to –1.7%, ending its six-week streak of being unusually low. The NAAIM Exposure index increased to 72.89 from 65.15 and is back above last quarter’s average of 63.74. Lipper fund flows for the week ending 4/5 had $8.5B of outflows in equities, the 7th of the last 8 weeks with outflows. Friday’s close saw NYSE new highs at 34 while new lows of 39 and the 10-day MA of New High/Low Differential is -14. The percentage of SPX stocks above their 50-MA is at 44.0% while those above their 200-MA was 56.8%. NYSI and NASI Summation indexes are above their 8-MA and in a short term buy signal. NYMO McClellan Oscillator closed at +28 and now back to a Neutral zone. The cumulative AD line is above the 40 EMA short term trend and back above the 89 EMA long term bull signal. CBOE Equity P/C 50-day MA at 0.68 and falling. CNN Fear and Greed index is in Greed zone at 57 from 55 last week. VIX/VXV ratio is back down to 0.871, which measures the spread between 1- and 3-month implied volatility.