Weekly Market View 5-18-25
Technical Market View
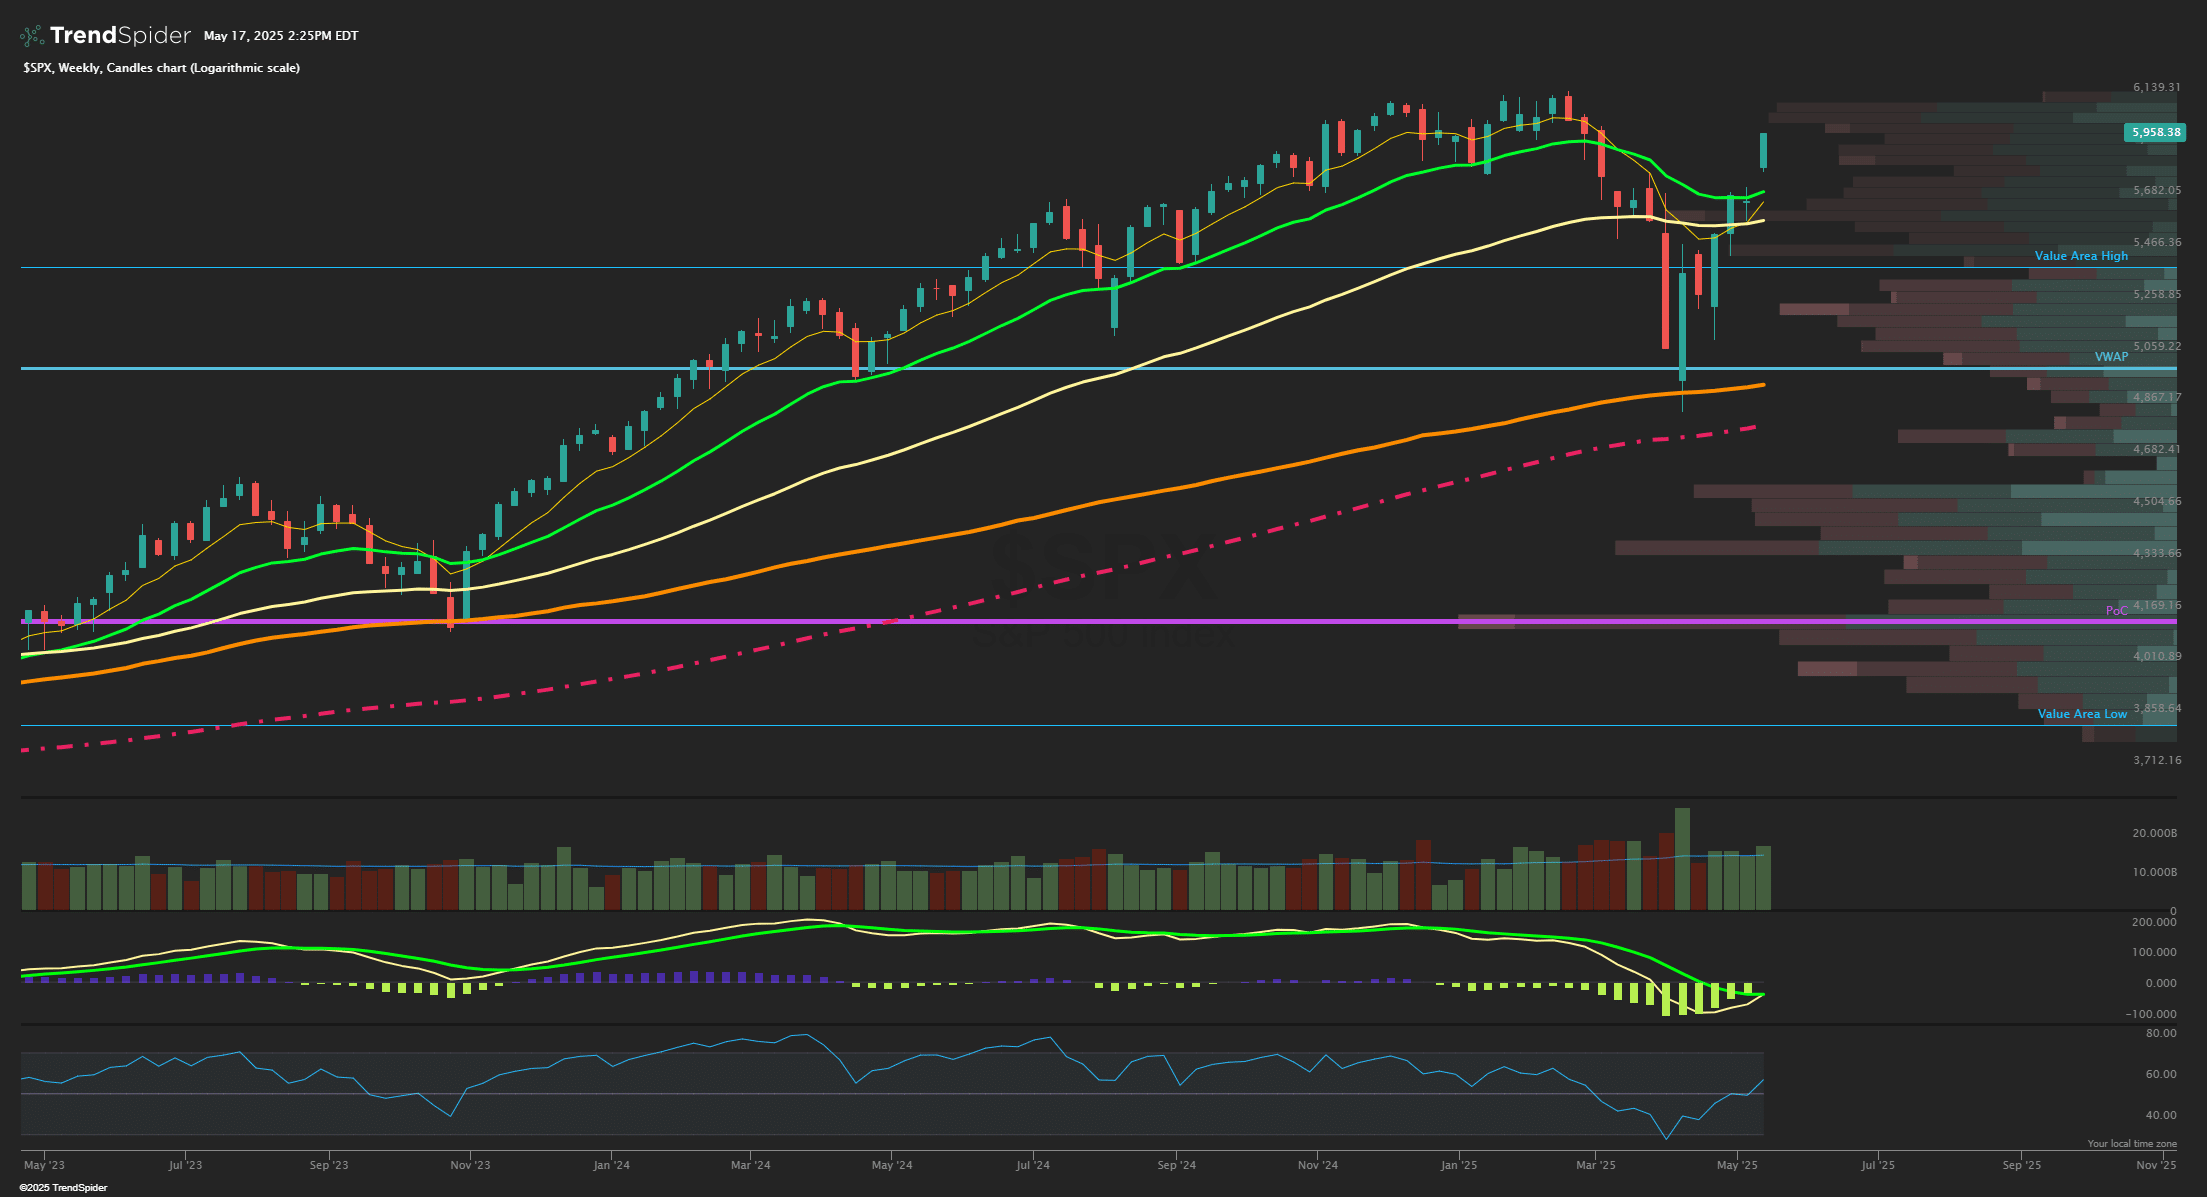
The SPX closed strongly higher on the week by over +5% and hit fresh 3-month highs since mid-February as many bullish signals continued to confirm the recent move as key and pivotal as a longer-term bottom likely was formed last month. Cumulative breadth metrics also show strength as it made a new high this past week, suggesting the SPX will soon follow but overall prices now look exhaustive into that monthly OPEX mentioned as a possible turning point short term. The 5900-level target was hit and now prices may see some pullback that would be healthy and constructive with first support at the 8 EMA of 5825 with the next larger level to focus on being the gap fill from last week near 5700 which also lines up well with a cluster of support levels being the one-year AVWAP and 200 EMA near 5650. Overall price action has held above the 8 EMA since April 22nd when the stronger breadth thrusts began advancing stocks higher. Daily RSI is very strong at 70 now and while a pullback is likely here, those strong RSI readings are actually the sign of a very solid market that will likely see dips bought. SPX also is just 3% from new all-time highs, which is quite likely to be breached sooner or later but the 6000 round number level should be enough resistance short term to allow prices to consolidate into month end perhaps and reset some stock charts into more favorable risk/rewards.
Market Sentiment/Breadth
AAII sentiment for the week ending 5/14 showed bullish responses rise to 35.9% from 29.4% prior while bearish responses fell to 44.4% from 51.5%. Neutral sentiment rose to 19.7% from 19.0%. The bull-bear spread (bullish minus bearish sentiment) increased 13.6 percentage points to –8.5%. The bull-bear spread is below its historical average of 6.5% for the 19th time in 21 weeks. The NAAIM Exposure index fell to 70.56 from 81.06 last week and is back near last quarter’s Q4 average of 72.50. Total equity fund flows for the week ending 5/7 had $-15.3 billion in outflows in equities. The prior day’s close saw NYSE new highs at 85, while new lows at just 11 and the 10-day MA of New High/Low Differential is rebounding to positive at +37. The percentage of SPX stocks above their 50-MA is at 79.0% while those above 200-MA was 58.4%. NYSI Summation index is still firmly above its 8-MA for a short-term bullish signal. NYMO McClellan Oscillator closed at +56 and now back to Upper Neutral zone short term. The cumulative AD line stayed strong and is making new all-time highs above the 40 EMA short term breadth trend and above the 89 EMA long term bull signal. CBOE Equity P/C 50-day MA is at 0.60. CNN Fear and Greed index is in Greed zone at 71 from 62 last week. The VIX/VXV ratio closed at 0.859 and under the key 1.0 level of inversion. This measures the spread between 1- and 3-month implied volatility, above 1.0 shows fear and can mark a low.