Weekly Market View 5-25-25
Technical Market View
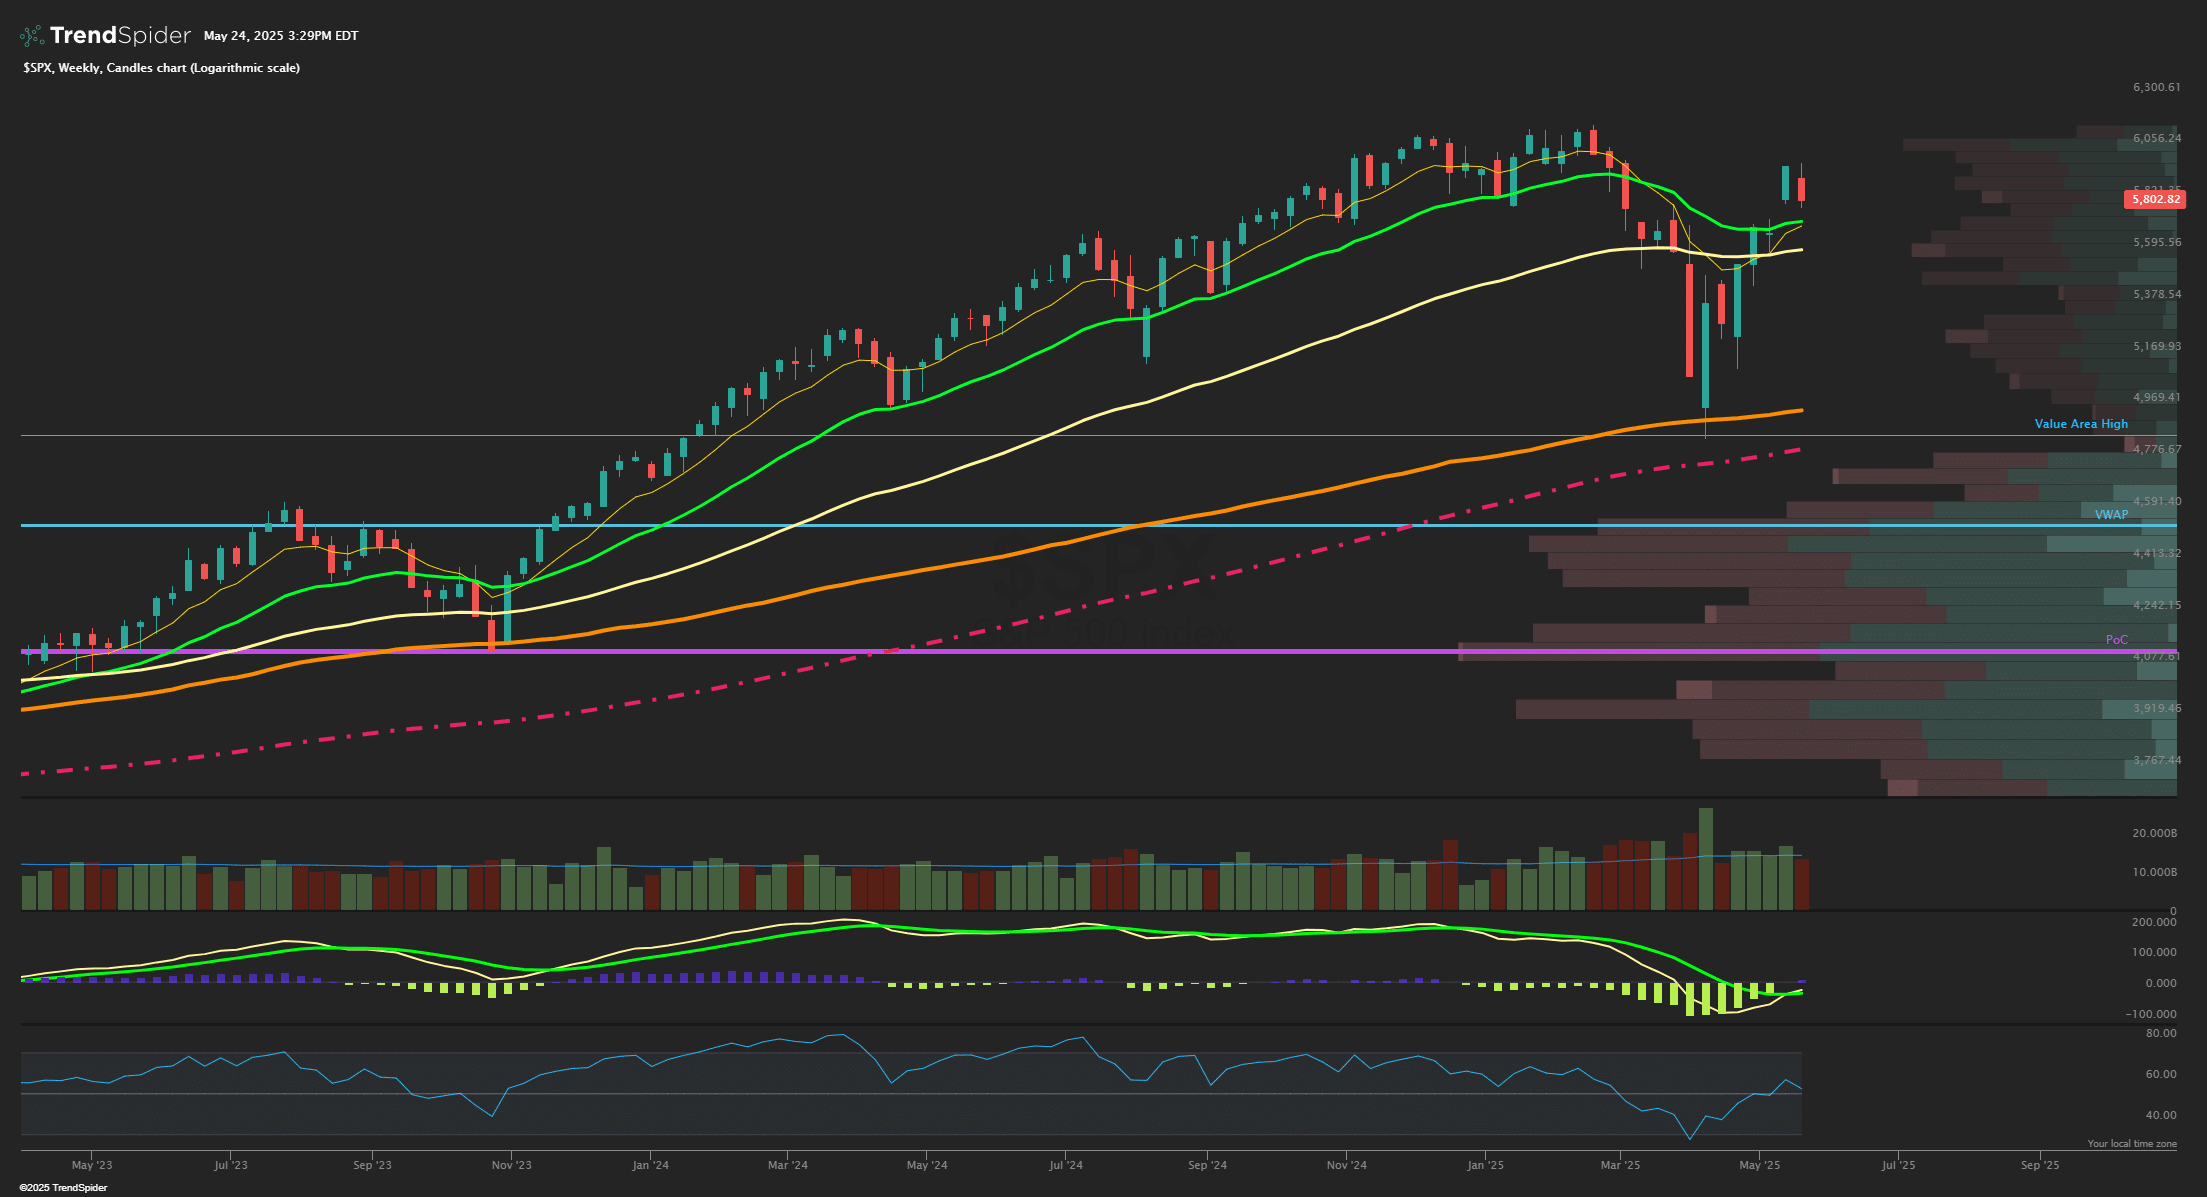
The SPX closed lower by -2.5% after the early week choppy action gave way to some expected pullback precisely after VIX May options expired Wednesday at the open. The post OPEX week retracement after a stellar rally in the past 6 weeks was not surprising, and markets still are quite healthy with the pullback to 5800 Friday potentially setting up some further consolidation to fill that open gap down into 5700 where stronger support exists in the form of the 21 week EMA. The weekly MACD also is crossing bullish showing the power of the longer timeframe should keep this pullback controlled and normal. Liquidity is the main issue as it still is thin and shows how sharp moves can be on the downside. The high this month has been 5968 so nearly getting to that 6000 round number which is stiff gamma resistance and markets may see more upside in the Nasdaq based Tech names that have led the rally higher since the lows. Overall, into late May and early June, there can easily be some overdue consolidation sideways between 5700-6000 to correct the sharp rally through time rather than downside price correction as many seem to be predicting. While the 200 EMA at 5670 should be solid support on a deeper pullback from here as it lines up well with one year point of control (POC) on the volume profile. Cumulative breadth making new recent highs suggest that the SPX should follow in the coming months if not sooner.
Market Sentiment/Breadth
AAII sentiment for the week ending 5/21 showed bullish responses rise to 37.7% from 35.9% prior while bearish responses fell to 36.7% from 44.4%. Neutral sentiment rose to 25.6% from 19.7%. The bull-bear spread (bullish minus bearish sentiment) increased 9.5 percentage points to 1.0%. The bull-bear spread is above its historical average of 6.5% for the first time in 16 weeks. The NAAIM Exposure index rose to 80.87 from 70.56 last week and is back above last quarter’s Q4 average of 72.50. Total equity fund flows for the week ending 5/14 had $-11.5 billion in outflows in equities. The prior day’s close saw NYSE new highs at 48, while new lows at 47 and the 10-day MA of New High/Low Differential is rebounding to positive at +36. The percentage of SPX stocks above their 50-MA is at 61.6% while those above 200-MA was 46.8%. NYSI Summation index is crossing below its 8-MA for a short-term bearish signal. NYMO McClellan Oscillator closed at -34 and now back to Lower Neutral zone short term. The cumulative AD line pulled back but is still above the 40 EMA short term breadth trend and above the 89 EMA long term bull signal. CBOE Equity P/C 50-day MA is at 0.59. CNN Fear and Greed index is in Greed zone at 64 from 71 last week. The VIX/VXV ratio closed at 0.937 and under the key 1.0 level of inversion. This measures the spread between 1- and 3-month implied volatility, above 1.0 shows fear and can mark a low.