Weekly Market View 5-4-25
Technical Market View
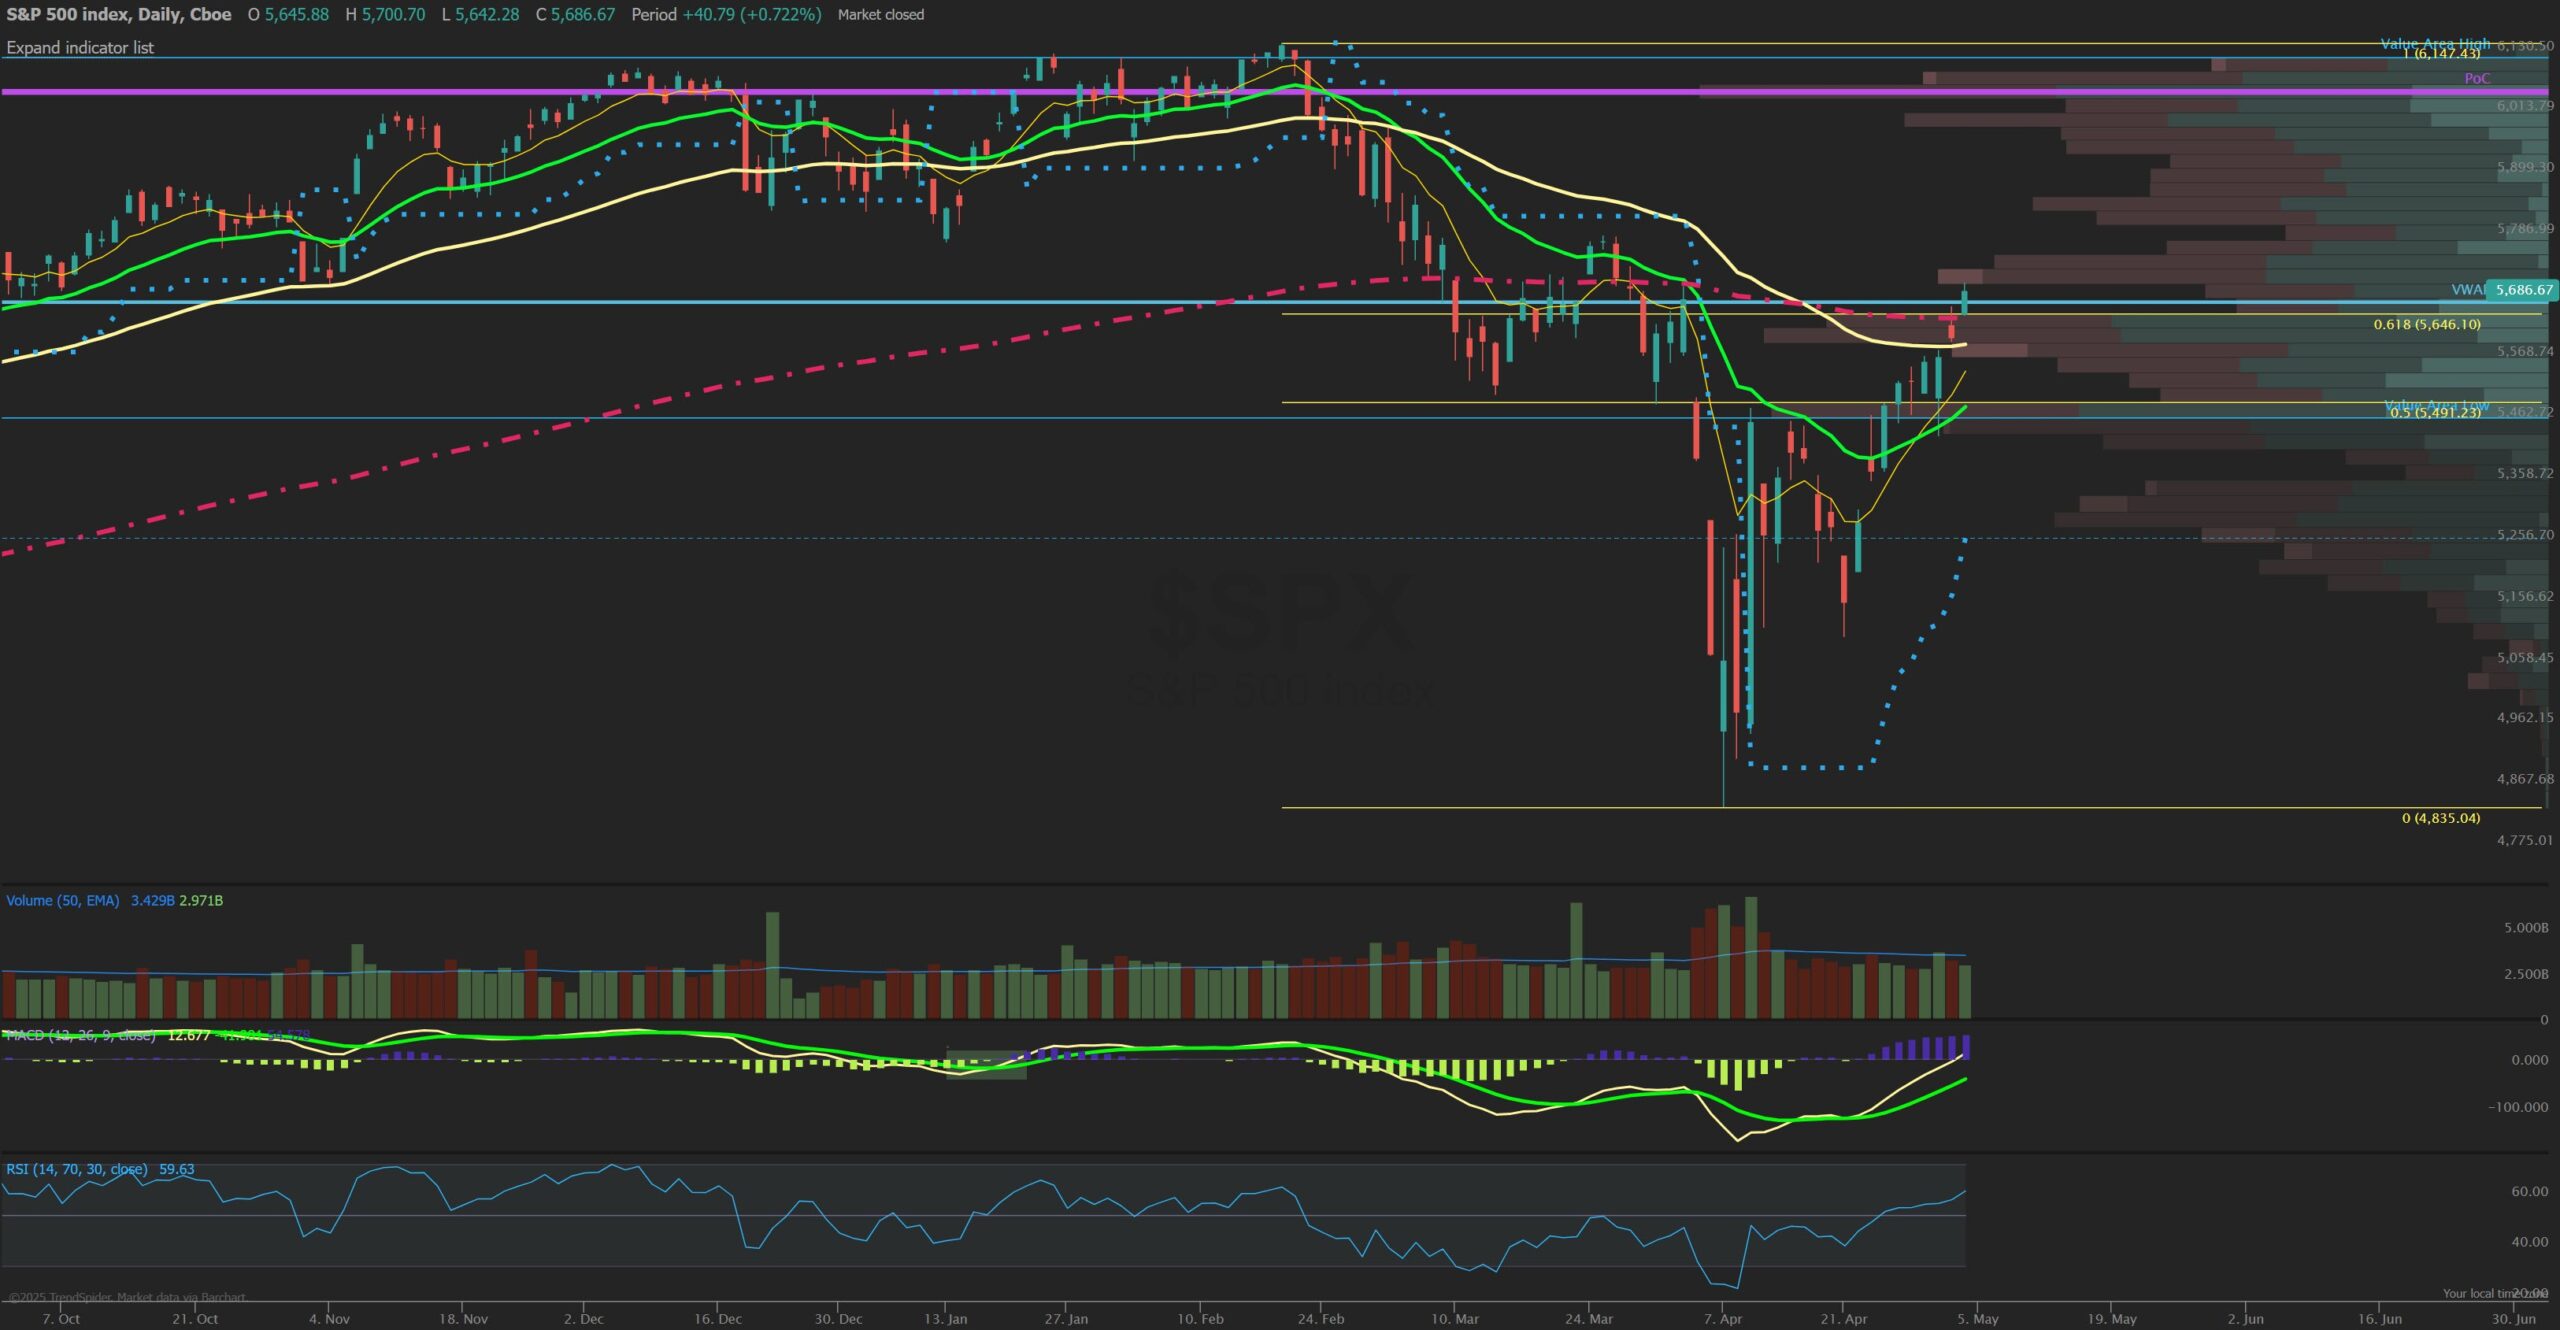
The SPX closed strongly higher for the week by a solid +3% and now higher for 9 straight days as the breadth thrust further confirms the recent bottom and the higher low last week above SPX 5100. The index now hitting 5700 and Friday closing above its 200 day EMA for the first time since the ‘Liberation Day’ crash. Friday also saw the SPX close above the 61.8% Fibonacci retracement level of 5646. This past week prices respected the first test of the rising 8 EMA after the 8/21 EMA bull cross to start the week showing momentum shifted firmly into the bull camp as RSI also got back over the 50 level for the first time since losing it in late February. Often traders will look to RSI to see what is overbought or oversold but one of the best ways to use the relative strength index is seeing when it moves above or below the 50 line and stays, aka focusing on being long when above 50 RSI. SPX now is short term extended and heading into a key week featuring the FOMC meeting as well as the week prior to monthly OPEX already. These days can see minor retracements ahead of expiration week so looking for a pullback would make sense but perhaps that occurs after SPX tests the late March high of 5800 roughly and possibly into a blowoff FOMC rally Wednesday would be an opportune time to lighten up and expect a pullback to the 8 EMA. With sentiment still low and technical indicators bullish, dips likely would continue to be bought into the May options expiration mid-month. VIX also sliding to one month lows Friday vouchers for easing risk and realized volatility.
Market Sentiment/Breadth
AAII sentiment for the week ending 4/30 showed bullish responses fell to 20.9% from 21.9% prior while bearish responses rose to 59.3% from 55.6% but stayed unusually high even after this sharp rally signaling very few traders are on board. Neutral sentiment fell to 19.8% from 22.5%. The bull-bear spread (bullish minus bearish sentiment) decreased 4.7 percentage points to –38.3%. The bull-bear spread is below its historical average of 6.5% for the 17th time in 19 weeks and is below –20.0% for the 10th consecutive week. This is the longest streak below –20.0% since a 12-week stretch between September 14 and November 30, 1990. The NAAIM Exposure index rose to 59.92 from 40.67 last week and is still below last quarter’s Q4 average of 72.50. Total equity fund flows for the week ending 4/23 had $-5.7 billion in outflows in equities. The prior day’s close saw NYSE new highs at 58, while new lows at just 24 and the 10-day MA of New High/Low Differential is rebounding to positive at +2. The percentage of SPX stocks above their 50-MA is at 56.4% while those above 200-MA was 44.0%. NYSI Summation index is now firmly above its 8-MA for a short-term bullish signal. NYMO McClellan Oscillator closed at +88 and now Overbought short term. The cumulative AD line surged higher and is above the 40 EMA short term breadth trend and above the 89 EMA long term bull signal showing the recent bottom is likely secure. CBOE Equity P/C 50-day MA is at 0.62. CNN Fear and Greed index is in Fear zone at 43 from 35 last week. The VIX/VXV ratio closed at 0.945 and now slightly under the key 1.0 level of inversion. This measures the spread between 1- and 3-month implied volatility, above 1.0 shows fear and can mark a low.