Weekly Market View 6-9-24
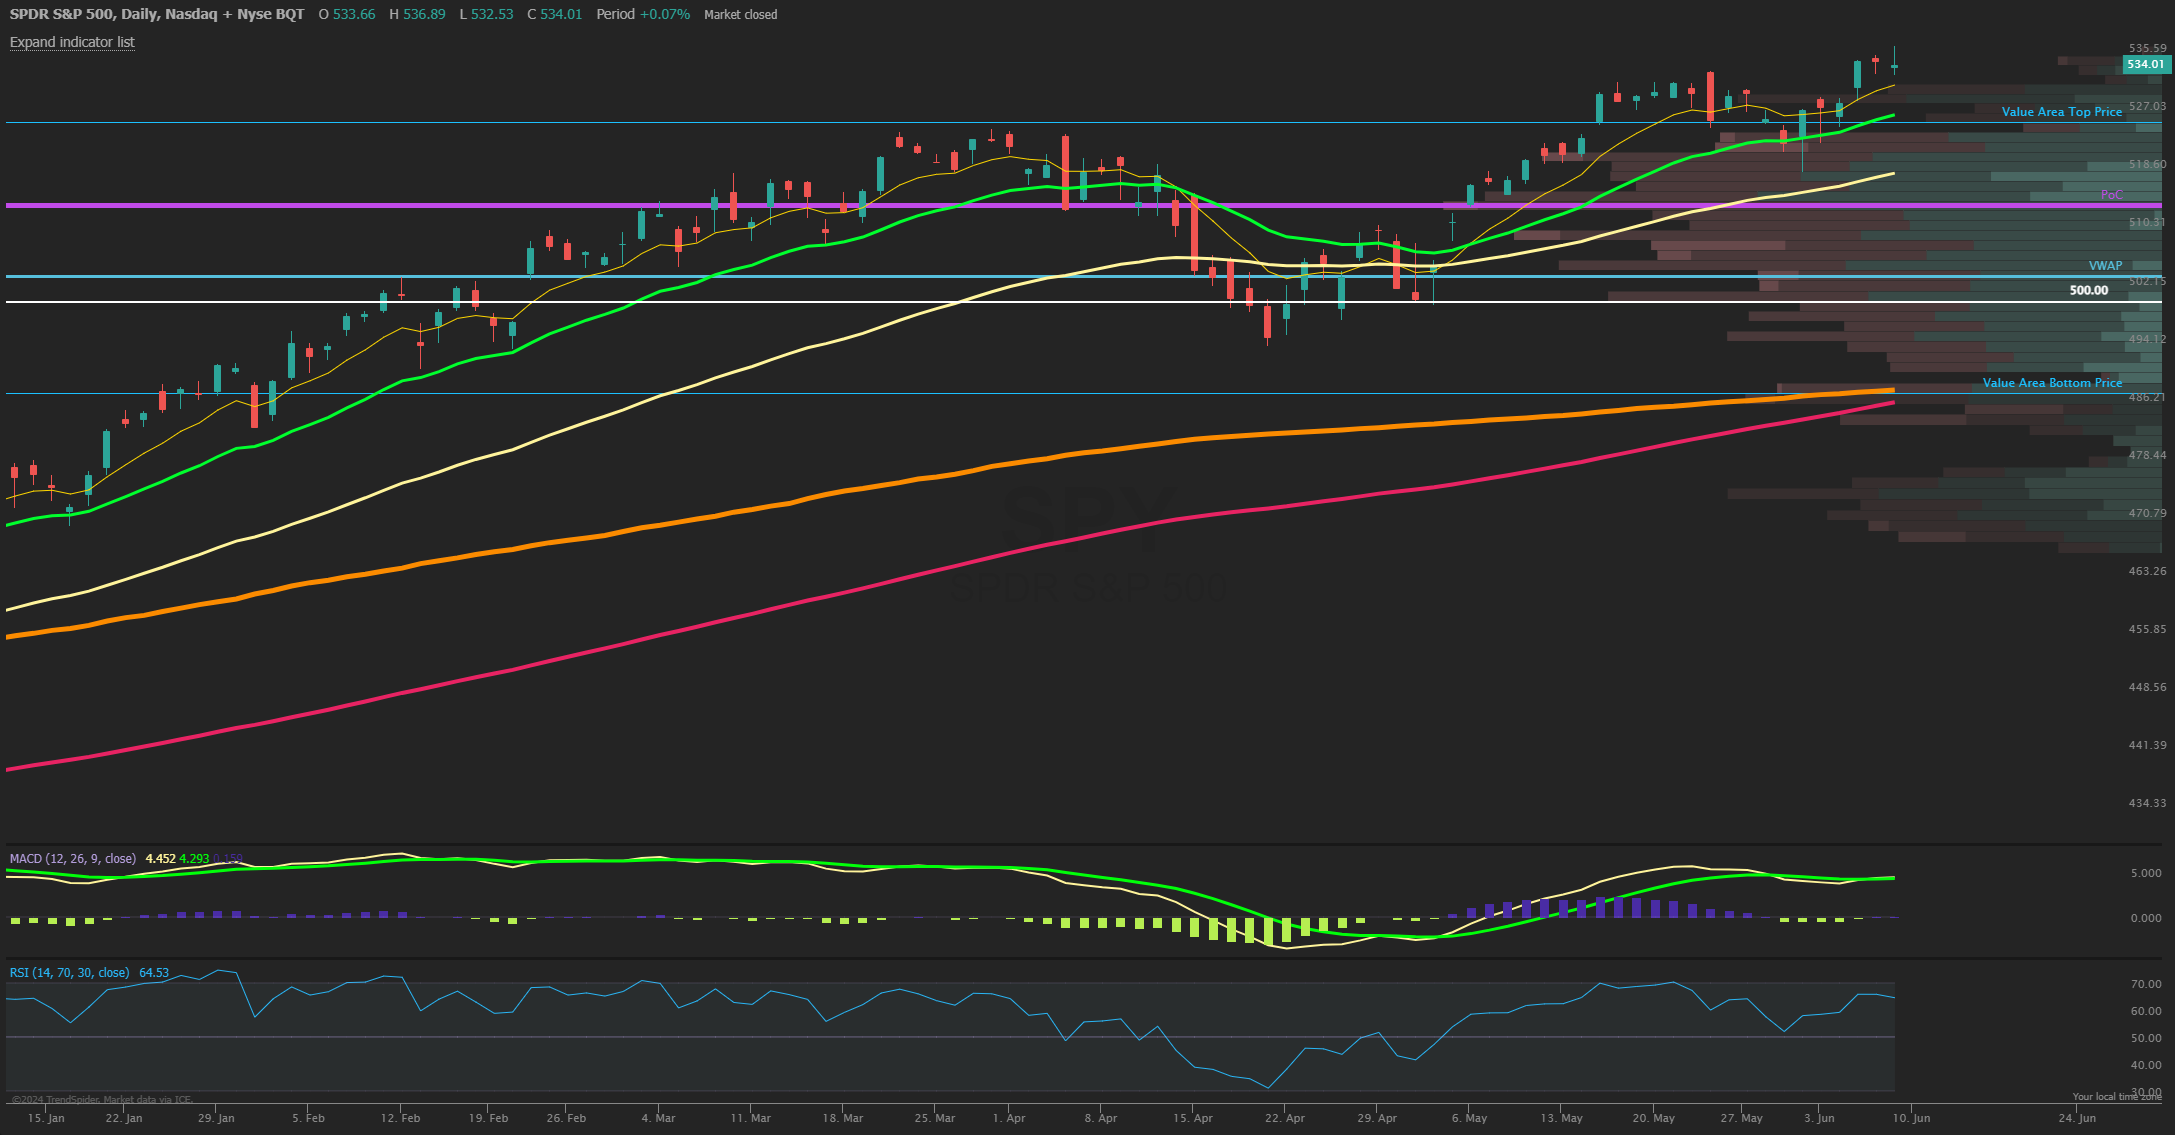
The SPX closed higher for the week by +1.4% and hit new all-time highs at 5375, now quickly rebounding over 150 points in the past 6 sessions after the bullish engulfing candle off key support to end the month of May. Breadth can be considered somewhat narrow into these new highs with mega cap Tech mostly in control and a large part of this move driven by NVDA and its momentum into the split, but new all-time highs are not bearish. The market now enters a key trading week with FOMC and CPI the main events on Wednesday which is also the week prior to the large triple witching June options expiration which comes around quarterly and is often a bullish expiration if markets are up trending, as they currently are. SPX has key support at 5300 short term and that should be a good line in sand for action into and after FOMC. The past 6 days rallied strongly higher so it would be normal for some retracement from here back into the 5300 level or about 530 on the SPY chart I shared below that includes the volume profile. The top of year-to-date value area comes in near 526 SPY and will be important to hold above for this next fresh leg of the trend higher to unfold. If that can expand higher and breadth increases after FOMC then all signs point to 5400 SPX into the June OPEX. A break under 5250 SPX can quickly retest 5200 with the YTD point of control also down at SPY 513 a bigger macro support into summer. June options expiration week also has a holiday on Wednesday with the markets closed on Juneteenth, this combined with a likely implied volatility crush post FOMC could take further wind out of the VIX which only boosts stocks into the expiration and by then could result in a chase higher into the end of the second quarter of the year.
Market Sentiment/Breadth
AAII sentiment for the week ending 6/5 showed bullish responses unchanged to 39.0% from 39.0% prior while bearish responses rose to 32.0% from 26.7%. Neutral sentiment fell to 29.0% from 34.2%. The bull-bear spread (bullish minus bearish sentiment) decreased 5.3 percentage points to 7.0%. The bull-bear spread is above its historical average of 6.5% for the fifth time in eight weeks. The NAAIM Exposure index decreased sharply to 68.65 from 92.21 last week and is below last quarter’s average of 84.57. Total equity fund flows for the week ending 5/29 had $-8.3 billion of outflows in equities. Friday’s close saw NYSE new highs at 54 while new lows of 57 and the 10-day MA of New High/Low Differential is still positive at +41. The percentage of SPX stocks above their 50-MA is at 49.2% so a touch on the low side while those above their 200-MA was 68.8%. NYSI Summation index is below its 8-MA for a short term sell signal. NYMO McClellan Oscillator closed at -33 and a bit below Neutral. The cumulative AD line is above the 40 EMA short term breadth trend and above the 89 EMA long term bull signal. CBOE Equity P/C 50-day MA at 0.65. CNN Fear and Greed index is in the Neutral zone at 45 from 48 last week. The VIX/VXV ratio closed at 0.848. This measures the spread between 1- and 3-month implied volatility, above 1.0 exhibits fear and tends to mark a low.