Identifying Support and Resistance Price Levels
Following up on the first post I wrote on an Intro to Chart Analysis, the next logical way to analyze price charts is by understanding how to identify support and resistance. These are pivotal aspects to knowing when to enter and exit directional trades and be prepared for potential trend changes if key levels break.
Support and Resistance represent important areas on a stock chart where buyers and sellers have shown more control in the past. Supply and demand levels in the market where prices are driven to as area’s of previous price memory. The market is constantly trying to find value and it moves back and forth between price levels that it has visited in recent times. Supply can be interpreted as bearish selling pressure while more demand can be associated with bullish buying pressure. In general as demand increases for a stock, prices rise and support levels are built higher. As supply increases for a stock, prices fall and this creates overhead resistance that builds lower. When both forces of supply and demand are more balanced and equal then prices tend to chop sideways as there is more of a tug of war between buyers and sellers.
Defining Support
Support is the price level or general zone of prices where demand is strong enough to create a floor in price. Like an auction that starts at an opening bid that is thought to attract enough interest from buyers, support is the level that buyers become more inclined to buy and sellers are generally less willing to sell. When prices reach a support level, the belief is that demand will be there to overcome supply and price should recover from that level. But as the markets are a dynamic ever changing mechanism that means that support does not always hold. Changes in trend sometimes start with a key support level being broken as sellers have gained control over the buyers. A decline below support indicates that bulls have either changed their willingness to again buy at the previously strong support level or that bears have lowered their expectations of where they are willing to sell. The aggressiveness of either side usually will dictate if the support level holds or breaks. This can be on a longer term weekly chart or even on a 15 minute intraday chart. Once support breaks, prices usually move more swiftly to the next support level as the market participants reprice what they believe is a fair price based on new market information.
Where is Support Created?
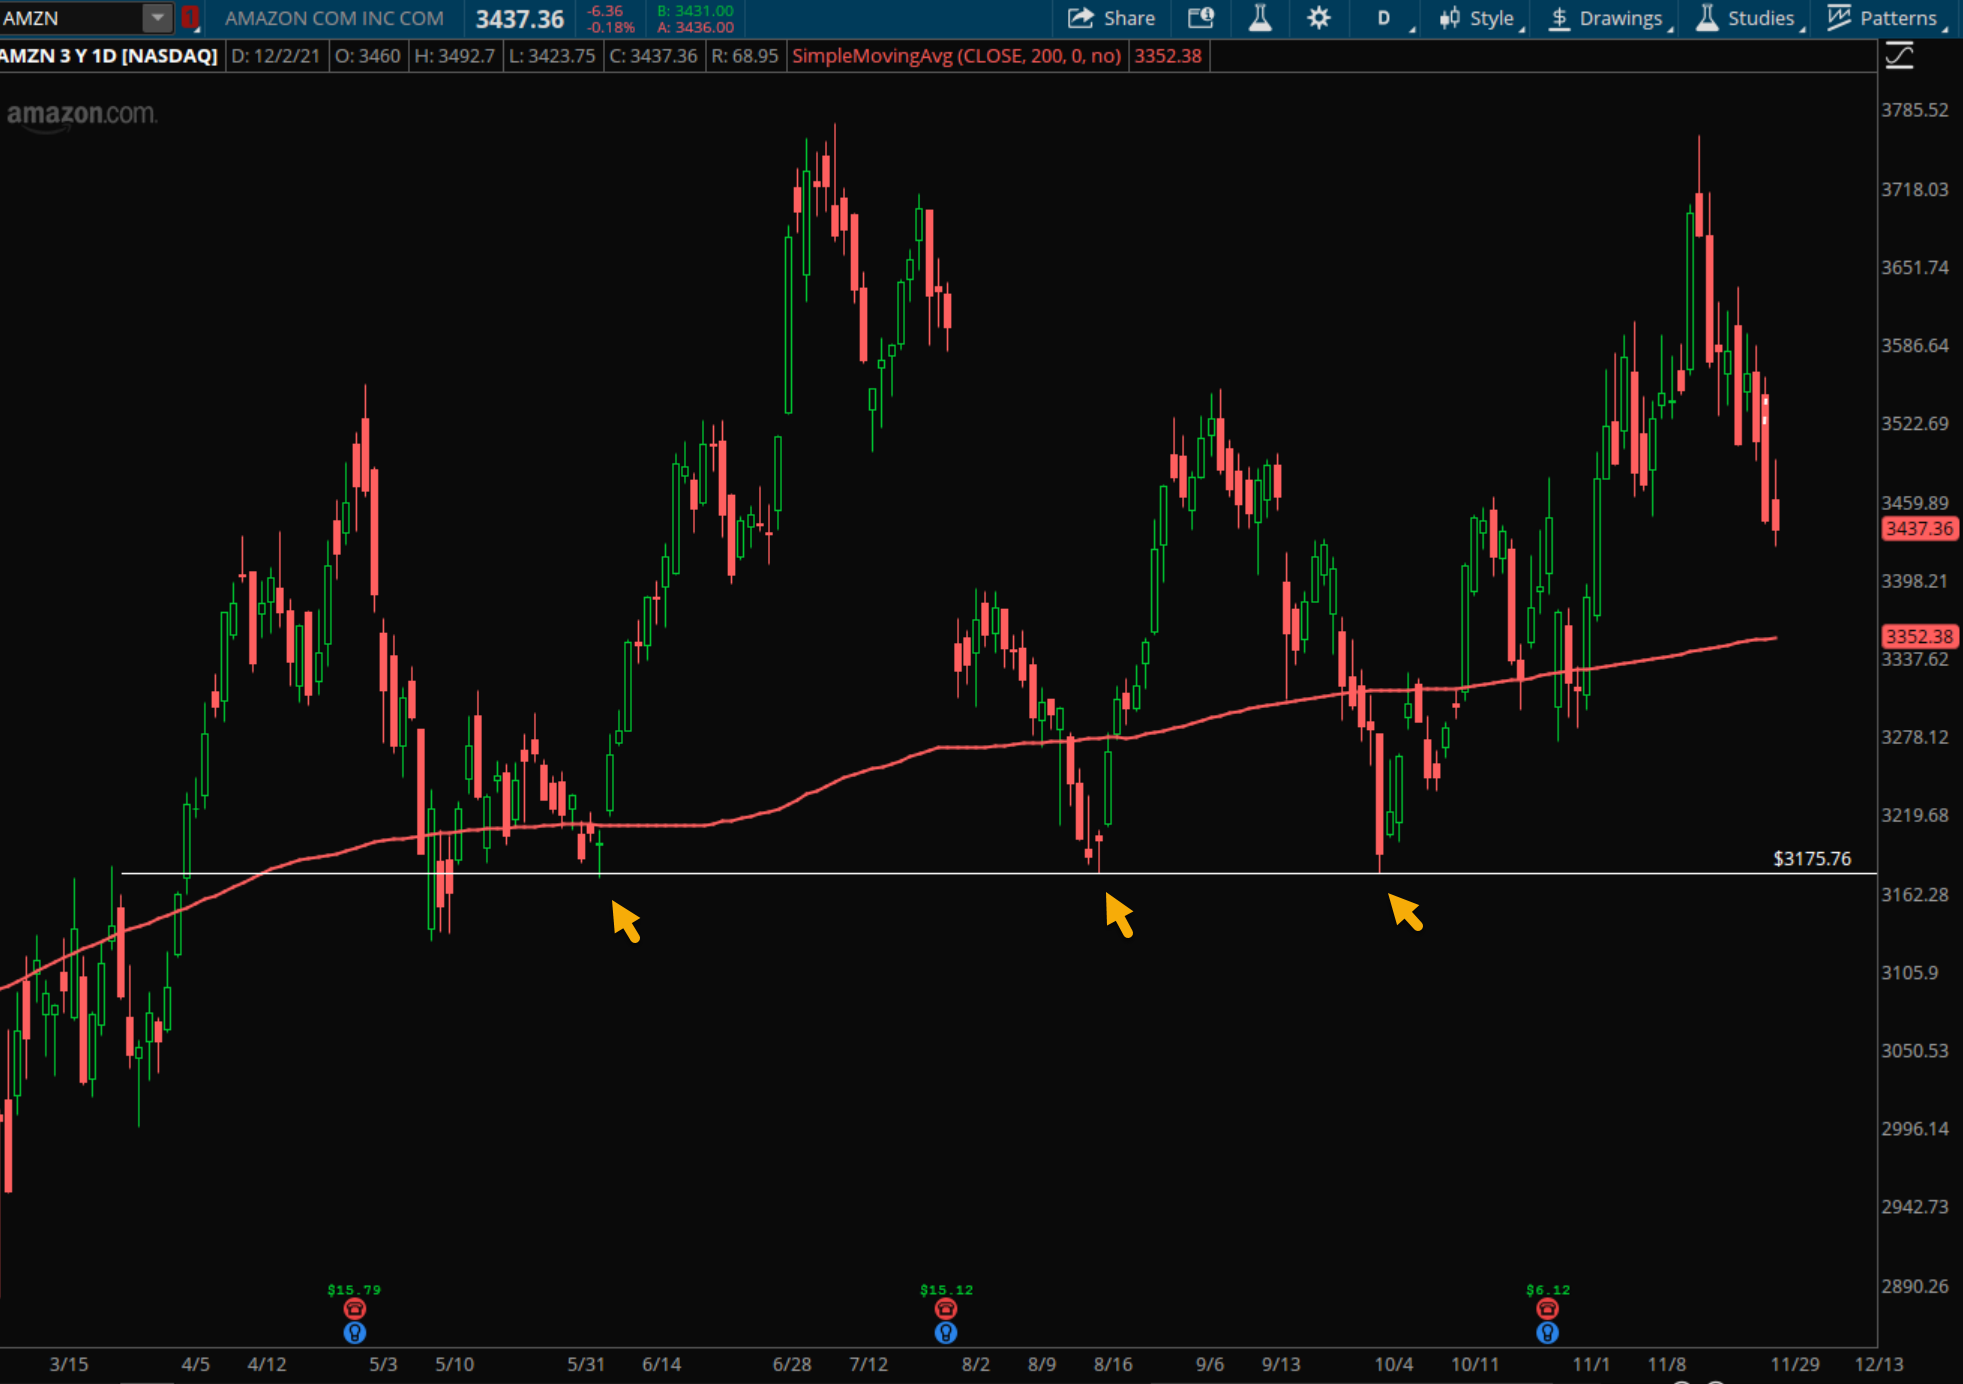
Support levels are generally below current prices because they act as a floor but sometimes stocks will trade on top of support and probe below and above as it establishes a zone of support. As you can see from the chart of AMZN below, the horizontal line shows the stock having strong support at the 3175 level three separate times throughout the year of 2021. Coming down quickly and bouncing off a key level like this shows that buyers were very willing to step up at that price zone each time to absorb any of the sellers that pushed it lower from higher prices. Often a support level will get probed for a few days but then recover and close back above so it’s generally best to refer to support as a zone or area where price is more likely to rebound from. Using weekly closes to confirm whether a support level holds or breaks is a good way to avoid traps as prices are volatile and can whipsaw traders out of positions. In this post I am mostly discussing horizontal support and resistance but there are also times where trendlines offer support and a key moving average like the 50 day MA provides a great support level to trade off from.
Defining Resistance
Resistance is simply the opposite of support. The price level at which sellers are strong enough to prevent prices from rising higher. Generally as prices rise, sellers become more willing to sell and buyers become less willing to buy. There are exceptions to this of course like if a momentum is breakout to new highs there are buyers playing the breakout and paying up but in the general sense of a normal trading range, higher prices entice sellers to sell, which creates resistance. By the time price reaches a resistance level from a previous high, supply will overcome demand and price will have a tough time rising through resistance. Again, it doesn’t mean it can’t blow through that ceiling eventually and hit new highs but on the first test of a resistance level it likely sees sellers keep a lid on prices.
Where is Resistance Created?
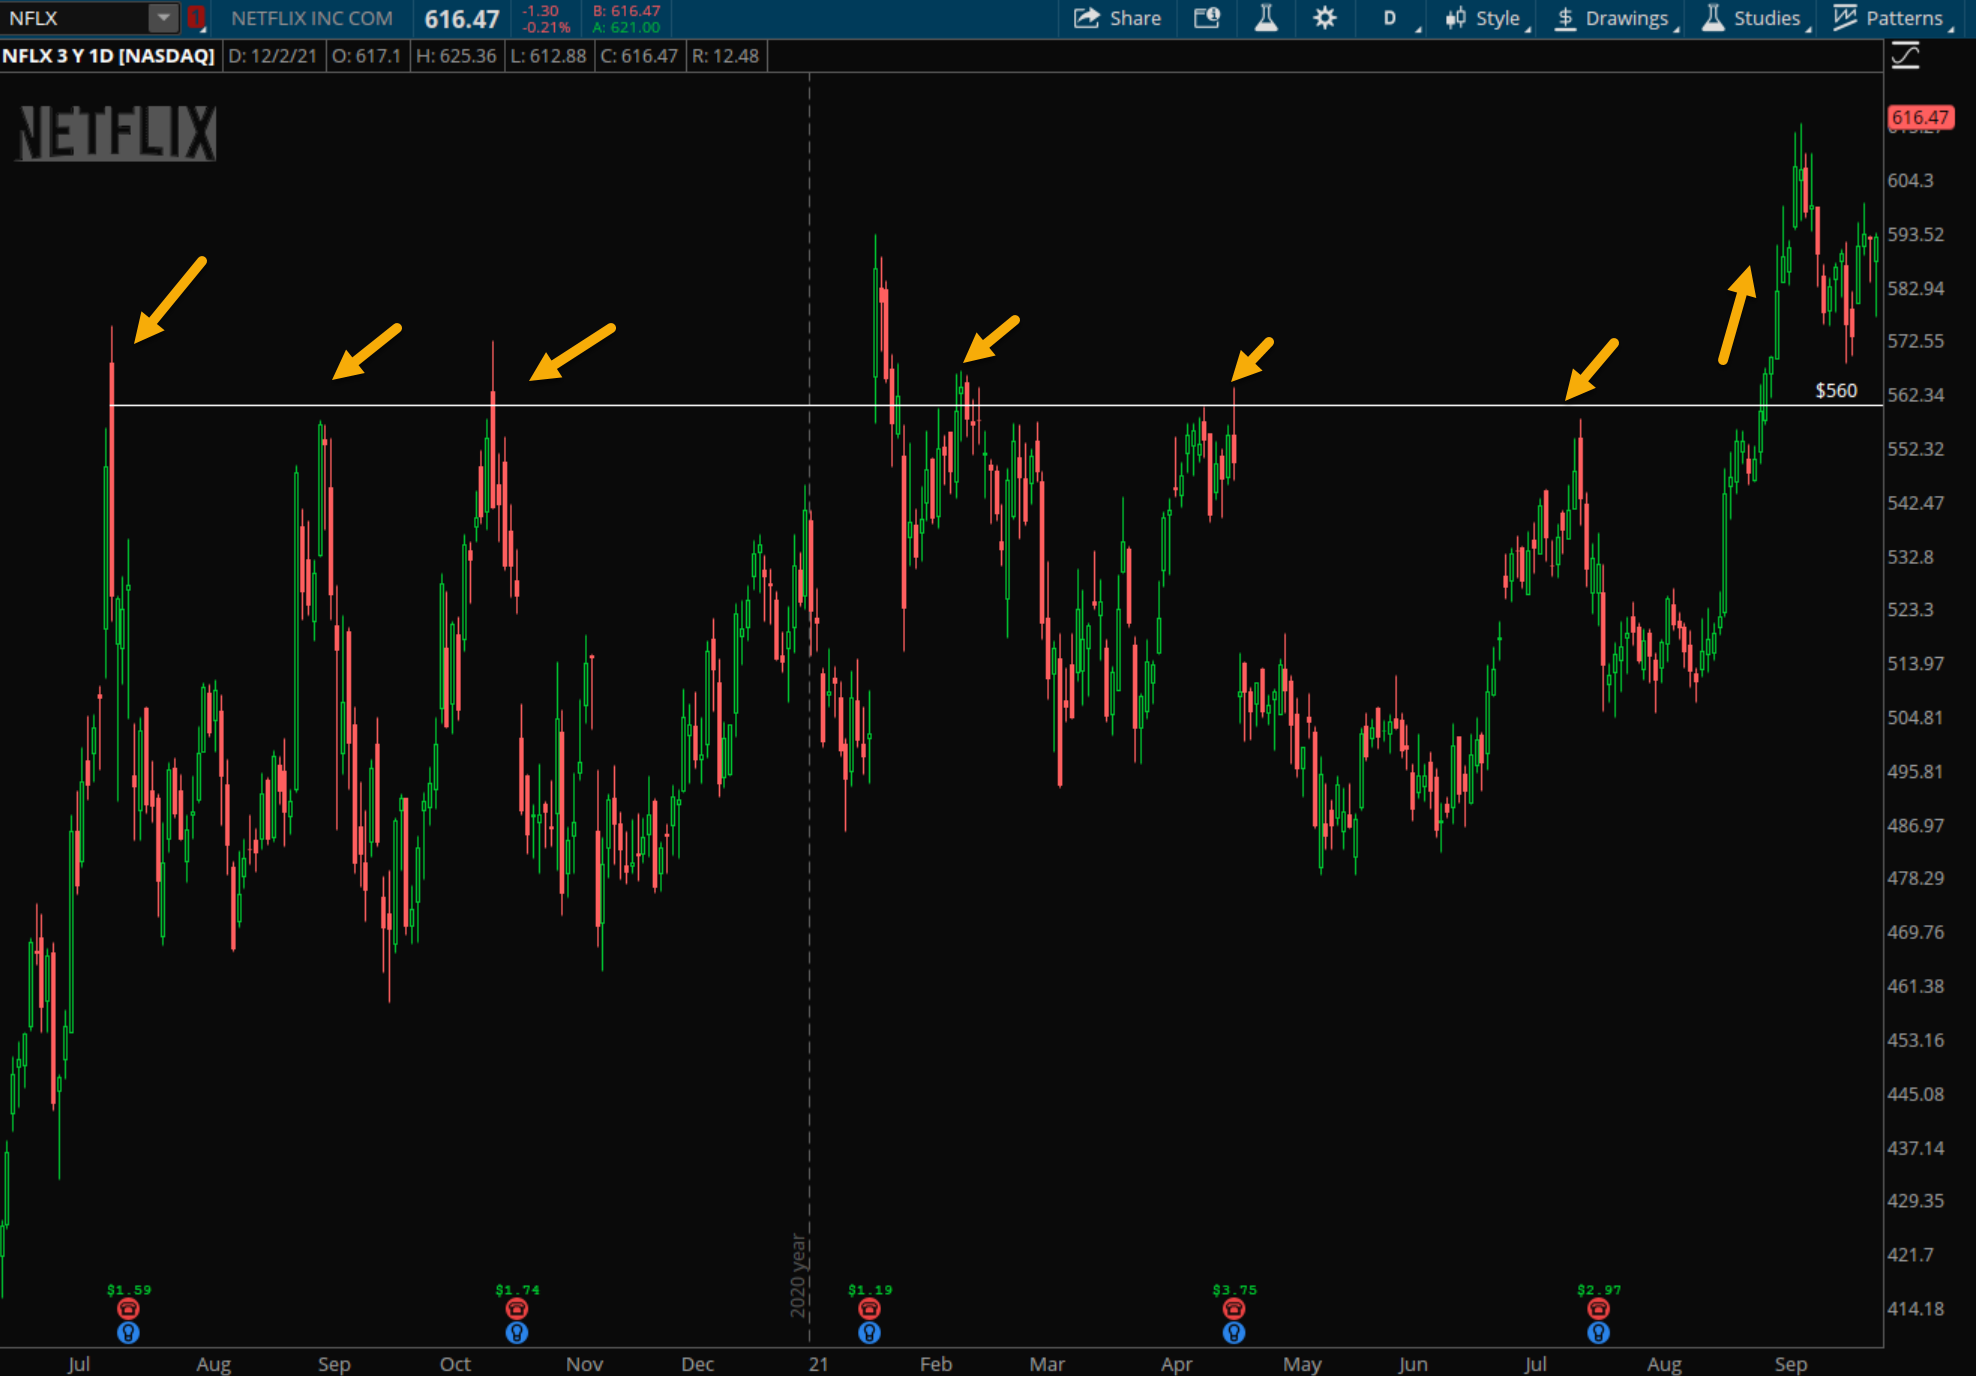
Resistance levels are above current prices because they are thought of as a ceiling for recent prices. Often though a stock will trade at or near resistance before it either rejects back lower from that ceiling or busts out higher above resistance based on stronger demand. Similar to support, prices can sometimes probe above resistance and then retreat back lower, creating a bull trap. This is why treating these price levels as zones or areas instead of exact prices is more wise. Technical analysis is not a science and markets are dynamic. As the chart of NFLX below shows how resistance was a general zone near the 560 price point for most of late 2020 into early 2021. The stock hit resistance at least half a dozen times over many months and fell back down below this 560 level. A few times it sneaked above for a few days but could not sustain buying demand. The market clearly was rejecting prices above 560 resistance. Until things changed in late summer and bulls were aggressive enough to launch the stock past 560 and much higher. Once large resistance areas like this break they tend to also become new support. Since price has memory it will remember that 560 as a previous level of importance.
Highs and Lows to Identify Support and Resistance
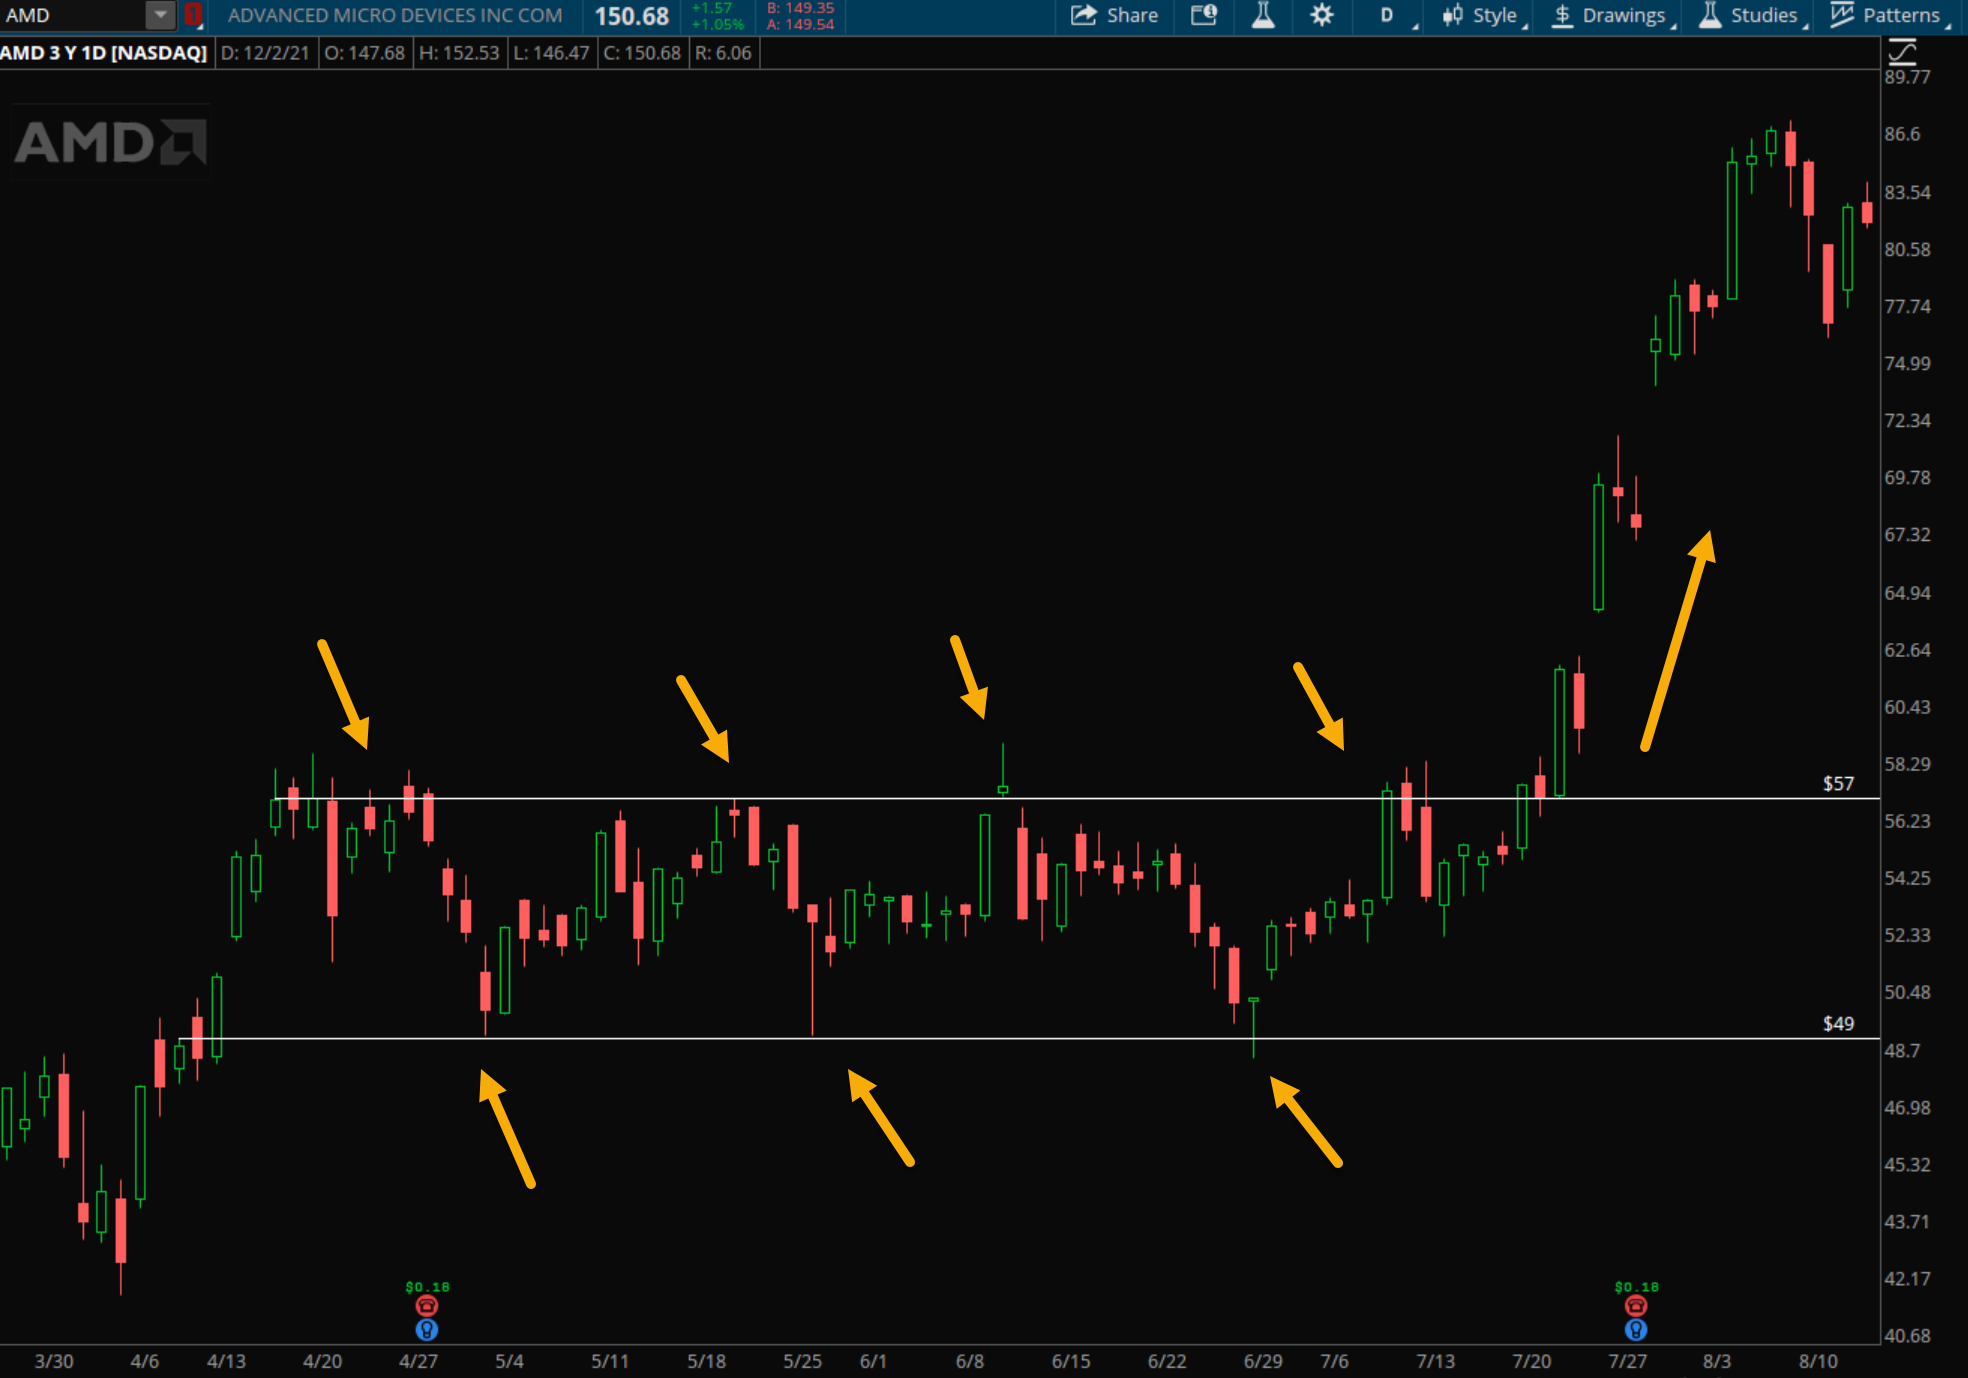
Finding where support and resistance are more likely to show up just comes down to observing charts and over time visually seeing where prices reject off from. By simply using previous highs and lows on a stock chart you can begin to see where support and resistance is formed over time. After each bounce off support the stock should try to make a higher high. If it is met with resistance at a previous high that means it may revisit support. This price action creates a trading range and eventually trading ranges are building up enough energy to make their next move. Growth stocks especially cannot stay in sideways trading ranges for too long because they are more volatile so a break of support or resistance is not a matter of if, but when. The below chart of AMD shows a choppy trading range between April and July of 2020. The stock created multiple tests of highs near 57, establishing clear resistance from sellers and also clear support near 49 from buyers creating a floor for prices. Each successive bounce off support made the stock stronger as demand increased. Eventually AMD broke free from its trading range in late July as it saw strong demand from buyers that made the stock breakout over 50% in less than a month.
Support Equals Resistance
Another concept I mentioned earlier was that when a key support level is broken it becomes resistance, or vice versa when resistance is cleared it becomes support going forward. These are sticky levels where price is attracted to retest against. When a resistance level breaks that indicates demand has overwhelmed supply so if price retreats back to that level it likely will be met by an increase in demand because it was that demand that originally drove price up through that price level. Sometimes when you are looking for a stock to breakout from a key level and you miss the trade, it often pays to wait for that initial retest of resistance now turned support to gain a new entry.
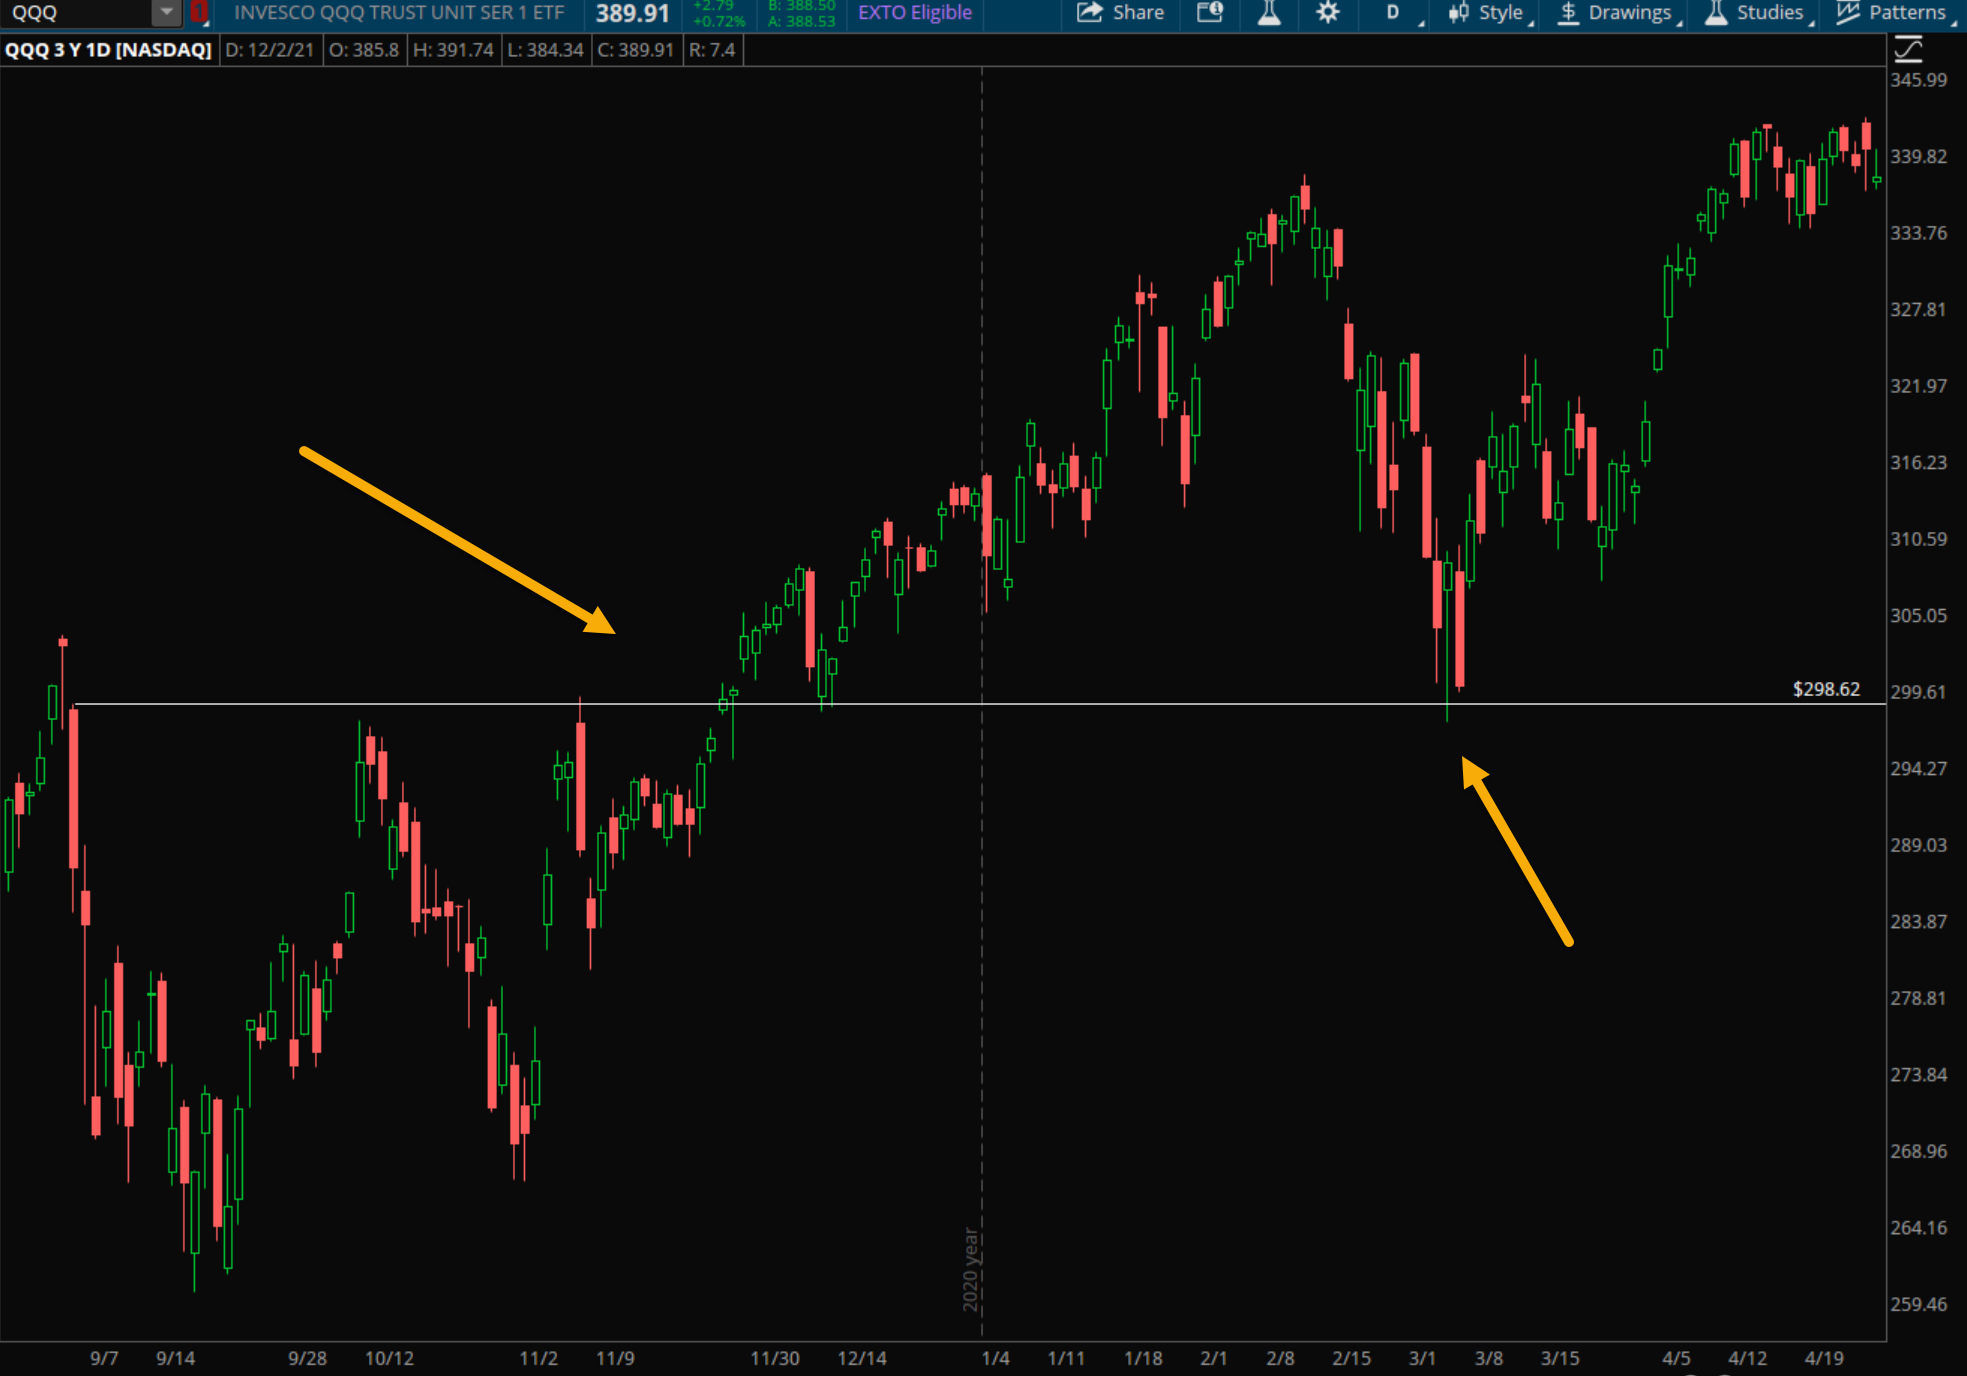
The chart of the QQQ Nasdaq 100 below shows prices from late 2020 into early 2021 as they broke out above 299 resistance. Once the QQQ cleared that 299 level it popped above and then retested that same 299 level within a few weeks. Then a few months later in early March, after a strong advance the stock came back to retest its former resistance of 299, which was now support and buyers were waiting patiently. Demand showed up and price never fell further, creating a strong rally off support back higher to a new resistance level closer to 340.
Takeaways:
- Identifying support and resistance levels is a crucial part of successful chart analysis.
- Even though it’s not an exact science and often tough to find perfect levels, focusing on general zones of where buyers and sellers might gain control is best.
- Being aware of where important levels exist goes a long way to increasing your market awareness and forecasting skills.
- If a stock is nearing a previous support level it can serve as an alert to look for signs of buyers stepping and reversing price back higher.
- When support or resistance levels break, it shows a change between supply and demand.