Trading the 8/21 EMA Crossover
What is the 8/21 EMA?
One of the trading concepts I refer to a lot is where a stock price is in relation to its 8 and 21 period exponential moving averages (EMA’s). Understanding where these averages are can help you see how extended a stock is in the short term and whether it’s ripe for a retracement back to its mean, aka average. This is the backbone of my trading on most timeframes as it combines both the shorter term 8 EMA and slightly longer term 21 EMA. There is nothing special about those amounts of measure, you can use a 10 period EMA and a 20 period EMA but I like the fibonacci based numbers which include 8 and 21. Some people use 5 EMA’s for a very short term look at trend but I have always liked the 8/21 EMA set of moving averages to determine trend because I am usually focused on trades anywhere between a few days to a few weeks. Sometimes up to a month as well which coincides nicely with the 21 day moving average as there are roughly 20-21 trading days in an average month. This gives you an idea of where price has been on average in the past month.
How to Identify Trends Using the 8/21 EMA
I trade a variety of strategies based on whatever the current market environment dictates. I might look at trading trends when the market price structure is clearly pointing to trend continuation and upsloping moving averages are often the best way to see this in an uptrend. I can look to the 21 EMA as a pullback buy point in a trend that is showing signs of setting up for a breakout, and often in a very strong existing trend, buying dips to the 8 EMA is a great way to enter into an ongoing trend. But when markets get volatile and choppy its best to focus on more mean reversion trading that looks for prices to revert back to its key moving averages from extended levels. So how do you know if the markets are trending or not?
Simply put if a stock is making higher highs and higher lows on any given timeframe, then it’s defined as an uptrend. You can even scan for new 52 week highs or 8/21 EMA crossover’s to see when a new trend may be underway. One way I like to use these crossovers is for directional bias of trend. Understanding the main trend in a market can easily be seen through the slope of the 8/21 EMA. Once we see a clear cross of the 8 EMA crossing above the 21 EMA, it shows the bulls are in control as the momentum of the short term trend has shifted up.
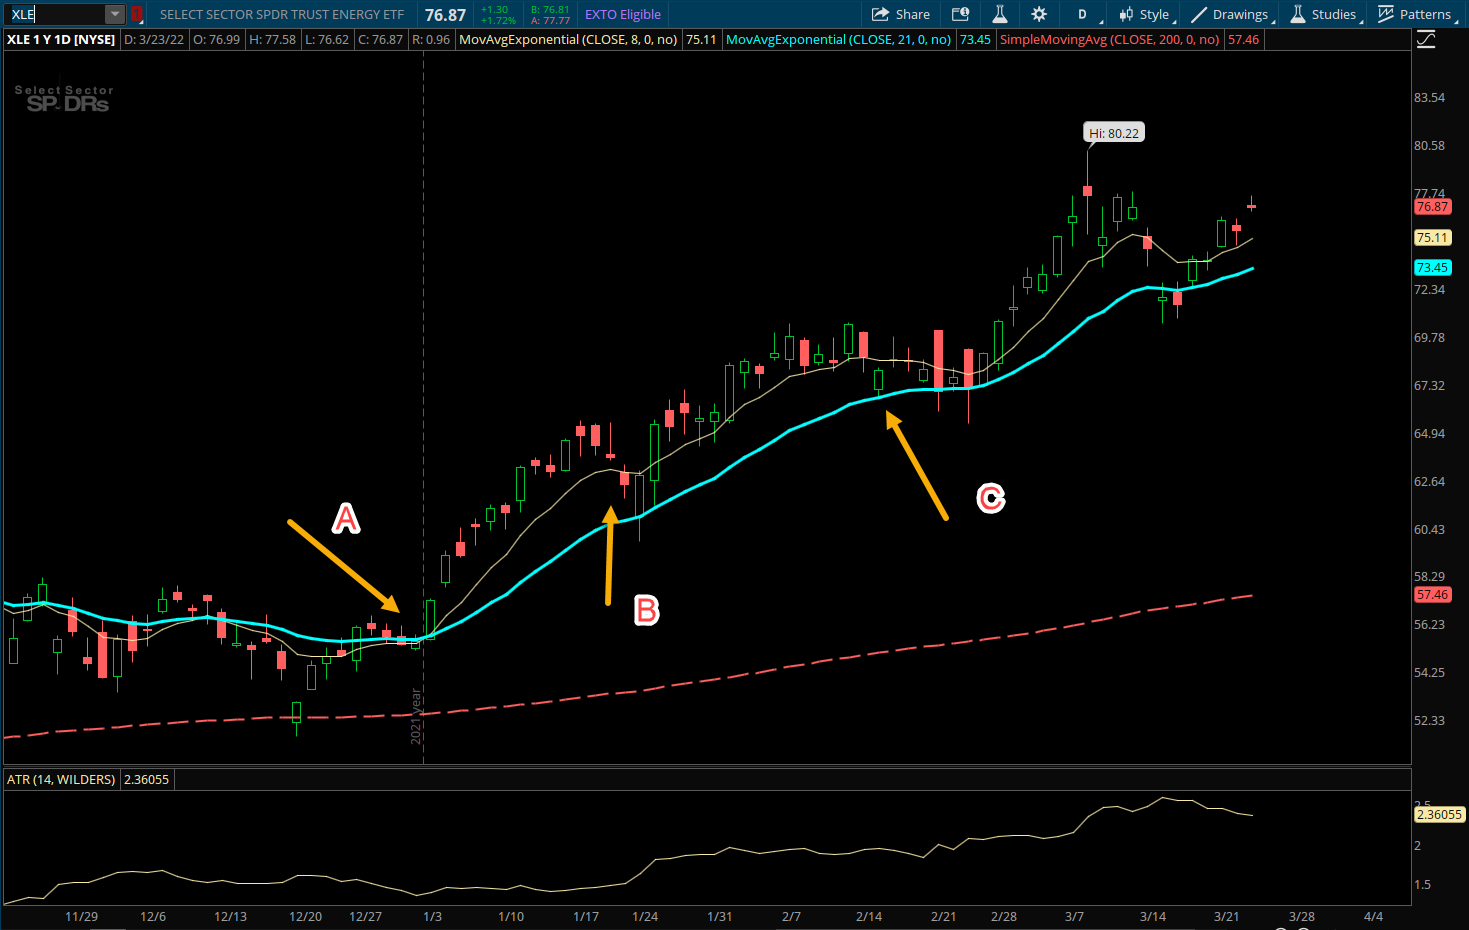
This is shown below in the chart of XLE, the Energy Oil ETF, which has been on a very strong run since the start of 2022. At the first arrow in early January, the 8 EMA crossed above the 21 EMA and the stock moved higher. Sometimes the stock runs away but any dip back to the 8 EMA would be a buy point such as at points B and C where the stock retests both the 8 and 21 EMA during the course of a week before launching higher off that 21 EMA blue line. In these examples, I have the 8 EMA as the thinner yellow line and the 21 EMA as the thicker blue line.
Understanding how much to risk depends on your trading style. With options it’s fairly simple as you can risk the premium paid of the option and let time play over the course of the trade as long as the stock does not close below the 21 EMA. Closing below that level often is a signal that the stock is not as strong as you expected and is an ok time to cut the loss. If I am trading stock I will often use an ATR based stop level. ATR stands for average true range and helps quantify the volatility of the stock so you have a stop loss at a level outside of the normal price fluctuations. Usually a stop loss level at 1.5 ATR’s is a good place to start and sometimes using 2 ATR for longer term trades is even better. If you are not giving your trade at least 1.5 ATR of wiggle room you will often exit a trade before even giving it a chance to unfold in the direction you had correctly projected. Trading is more of an art than a science in my opinion and I have benefited from using smaller position sizing initially and giving my short term trade ideas a bit more freedom or space to play out as long as the big picture trend is still intact.
Trading Rules for the 8/21 EMA Cross Setup
So you found an uptrending chart and the stock is above all its key moving averages. Now you want to buy a pullback to the 8 EMA. Using alerts is a great way to use your trading platforms technology to let you know when price is nearing or hitting the 8 EMA price level. These levels change each day as prices move and the moving averages continue to rise in uptrends, and fall in downtrends, etc. If you are focused on swing trading then there is little point in watching a stock all day. Set your price alerts and wait for them to come. You can even just enter limit order prices once you know the 8 EMA price level you are willing to buy at.
Trade Rules:
- For the purposes of this post, I am using daily charts which is the most common timeframe most traders focus on but feel free to use on weekly charts if longer term or on 60 minute charts if more short term focused.
- After the 8 EMA crosses above the 21 EMA, buy the stock on a pullback to the 8 EMA. Set a stop at 1.5 ATR (Average true range) or a close below the 21 EMA, whichever is greater. You want to give the trade some room to play out.
- The target for the trade is at least 1.5 ATR but I often try to target 3 ATR to give myself a 2 to 1 reward to risk ratio. So if the stock has an ATR of 4 points, I want to set my stop at 6 points (1.5 ATR) and my profit target at 12 points (3 ATR).
- This is all subjective based on market conditions and your personal trade plans but you can also use 1.5 ATR’s as a first target to scale out of the trade and then move the stop to breakeven, as you hold on for the second higher target. This is often a good idea if the chart shows some other resistance on the way up.
- A good way to increase your odds on a trend trade like this is to only take trades on the daily which agree with the longer term trends on the weekly chart. So if the weekly chart is strongly trending higher, buying pullbacks to the 8 EMA on the daily chart will be that much higher probability. Also using the 200 day simple moving average is a good way to see the long term trend so you would be better off buying dips to the 8 EMA when prices are above the 200 day MA.
Trade Example #1: AAPL – June 2021
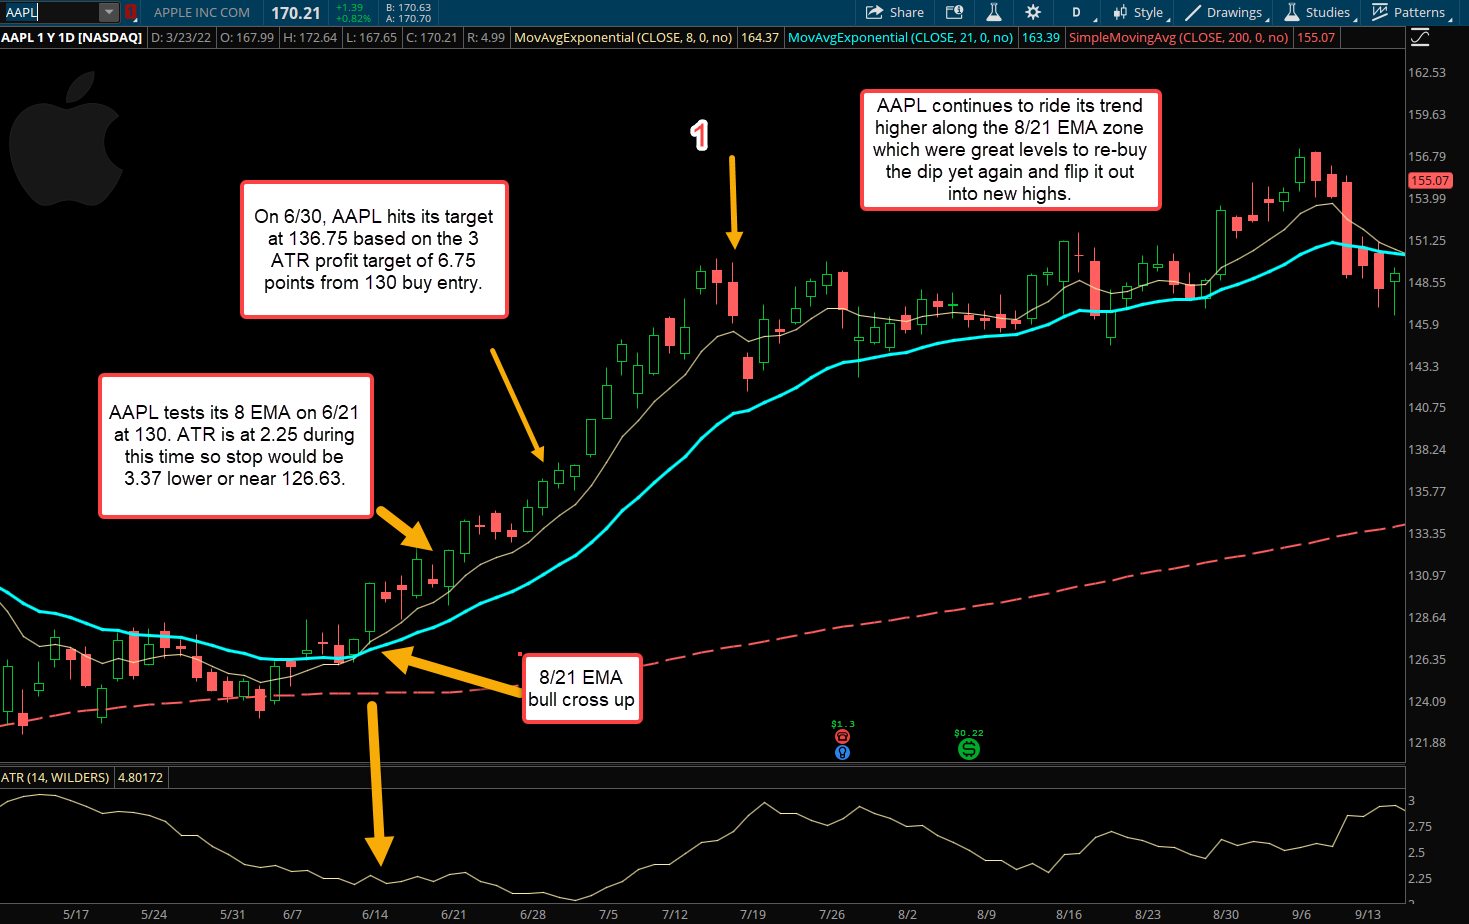
Using the daily chart of AAPL from June 2021 we saw a bullish cross higher on the 8 EMA moving above the 21 EMA, showing a shift in trend. We would then want to see a price pullback to the 8 EMA for our buy entry. This occurred on June 21st at roughly 130.00. The stock bounced off that key price level after probing lower and closed at the highs of the day. These are often the best entries when stocks pull back at the open or early in the day only to recover by the close as buyers swoop in. I always prefer to focus on the closing price of a stock because as the old saying goes, “amateurs open the market, but professionals close it.”
AAPL had an ATR that day of about 2.25 points so taking our ATR and multiplying it by 1.5 gives us a solid stop loss level to exit if the trade doesn’t work out. This stop level comes to about 3.37 points so we bought at 130 and our stop price would be 126.63. These are just examples so rounding up or down is fine too. Personally I prefer using options so I can define my risk at the onset of the trade and not worry much about setting stops. I know my max allowable risk when entering into an option trade and that means I won’t get hurt from an unexpected gap against me because I already committed my preferred amount of capital to the idea. A common rule I like to use might be position sizing an option trade between 1-3% of your account size depending on your risk appetite. The smaller your account size the higher your position size will need to be of course, so going higher is sometimes needed but if you risk 5% or more on one trade, you really need to be wary of how many directional positions you have on at one time.
Our target on this setup is 3 ATR so taking the ATR value of 2.25 and multiplying by 3 gives us 6.75 points on the upside. From a 130 buy entry, we can set our profit target up at 136.75. This is a great method to use and adapt to changing volatility levels in the market as the average true range (ATR) will constantly change week to week based on current market volatility. A simple percent stop loss is not good enough as a 5% move in the stock during volatile markets might be normal daily action compared to a move in a stable market where targeting 5% might take a week.
Finally about 10 days later the AAPL trade hits the profit target on June 30th at 136.75. At this point you can either look for a new buy on a pullback to the 8 EMA or move on to the next stock setting up with a fresh bullish crossover. A quick thought on profit targets, in this example you can see the stock kept running higher even after we sold it for a profit. Welcome to trading. You’ll never catch the top or bottom but one way to change this up is to sometimes just take half your position off at the predetermined profit target and then wait to sell the rest on a close below the low of the high candle. This eventually happened at point 1, as the candle closed below the low of the highest candle day, near 146.
Trade Example #2: CF – February 2022
In the chart below I tried to explain most of the setup but CF is a hot agriculture stock in the right sector so a strong trend has been in place for much of 2022. Back in late January, CF saw a bullish 8/21 EMA crossover which gave traders a signal to buy. On 1/30, the stock hit the 8 EMA on a pullback and proceeded to rally higher. Normally targeting 3 ATR as a profit on this setup is optimal but CF also had its earnings report due in less than 2 weeks so this will often need to be a consideration since stocks have 4 earnings reports a year and you will want to avoid holding a short term technical based trade into a binary event such as earnings. For this example, it shows why using a little discretion makes sense as we got 2 ATR worth of movement (6 point rally in two days) ahead of earnings, so it was prudent to take the smaller win. In this scenario if I like the long term trend of a stock I will gladly keep an eye on it and check it post earnings to see if the setup reemerges. As luck would have it, a few days after CF reported earnings on 2/15 it shook out some participants under the 21 EMA and then closed back above its 8 EMA as the stock began to coil in a tighter range. This often proceeds a breakout when the longer term trend is up and so buying near the 8 EMA price level at 74 made sense.
With our ATR now at higher levels since the stock’s volatility has increased, we now have a larger stop loss point and target profit level on the upside. Using an ATR of roughly 4 points, this gave us a stop loss of 6 points below our buy at 74 and a profit target 12 points above which means we want to sell our CF trade at 86. A little more than a week passes, and our target of 86/share is hit. The stock continues to trend a few points higher but sticking to your plan is the consistent repeatable process that will help you develop long term habits as a trader. The arrow on the far right shows a possible reentry point on CF as the stock pulled back to its rising 8 EMA near 90 and then rebounded nicely as it continues to trend above its 8/21 EMA up until the present day today on 3/23 hitting 104 a share.

Takeaways:
- I enjoy using the 8/21 exponential moving averages as a guide in trading and investing. Simply visualizing the slopes and trends will save you a lot of headaches when trading trends.
- Trading the 8/21 EMA crossover is a great system to use in a trending market. Trading in the direction of the overall broad market trend (SPY, QQQ) will increase your odds as well.
- Buying a pullback to the 8 EMA and using a 1.5 ATR stop loss with a 3 ATR profit target is a great way to participate in a trend without overthinking it.
- Trading in the direction of the longer term weekly chart trend will increase the odds of trades you take on the daily chart. Better yet, watch for pullbacks to the weekly 8 EMA when in a strong trend and catch the much bigger multi month trends that tend to keep going.
- Using other combinations of EMA’s is useful too. The 13/34 EMA using the same strategy can be a more longer term strategy or even the 21/55 EMA. Fibonacci numbers are interesting to me as a way to choose your length of time frame but it’s all just personal preference.