Weekly Market View 3-19-2023
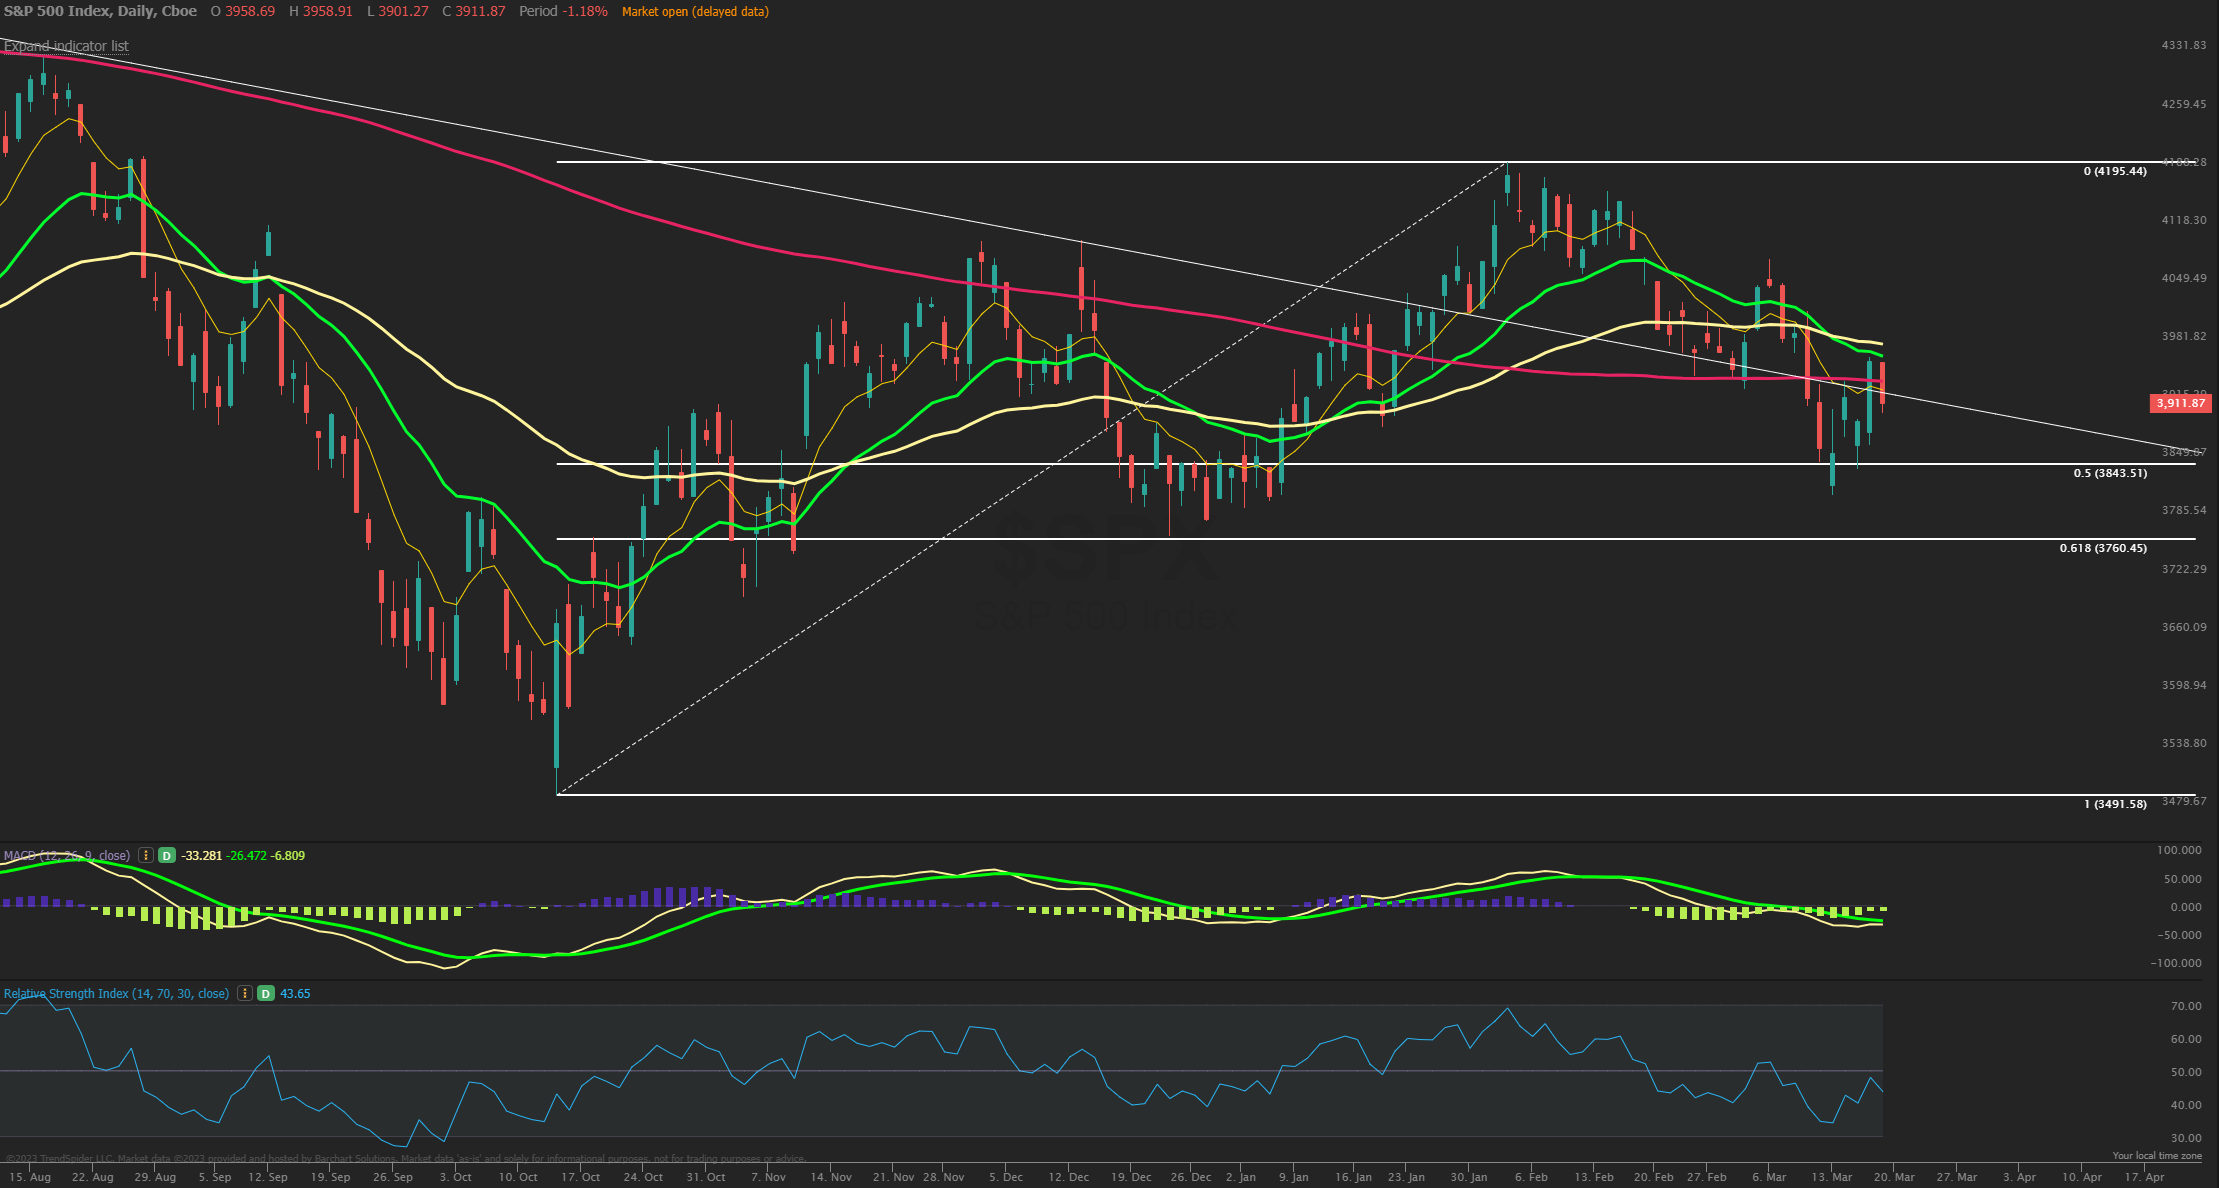
The SPX had a wild week but closed higher by +1.5% after seeing capitulation panic selling to start Monday with the VIX hitting 30. The low for the week came just shy of 3800 which is a monster support level lining up with the December lows and recovered back up to the 3930 level before closing mid-range for the week at 3916. The 21 EMA right above here comes in at 3965 with the 200 MA being a magnet lately sitting at 3925. The Nasdaq tech sector had a solid outperformance this week closing back above its key moving averages and has the potential to lift the SPX higher if that continues. MACD is showing some bullish divergence and a few more days of upside would likely trigger a bullish MACD cross signal. Sentiment is poor and these conditions are ripe for surprise upside moves so with the FOMC meeting this week whatever expectations are into midweek could be reversed sharply post FOMC. Currently it seems bearishness is a bit overwhelming and with risks looming the broad market has held up quite well. Closing above 4000 would invite a bullish lean back to 4065-75 which is big resistance into quarter end. Support is at 3850 and 3900.
Market Sentiment/Breadth
AAII sentiment for the week ending 3/15 showed bullish responses drop to 19.2% from 24.8% prior while bearish responses rose to 48.4% from 41.7%. Neutral sentiment fell to 32.4% from 33.4%. Bullish sentiment hitting a 6 month low this past week. Optimism was last lower on September 22, 2022 (17.7%). Bullish sentiment is at an unusually low level for the fourth consecutive week and the 44th time out of the past 63 weeks. The bull-bear spread (bullish minus bearish sentiment) decreased by 12.3 percentage points to –29.2%. This week’s bullish sentiment reading is the 34th lowest recorded since the Sentiment Survey started in July 1987. NAAIM Exposure index decreased to 41.92 from 60.11 and is back below last quarters average of 51.03 and making 3-month lows. Lipper fund flows for the week ending 3/15 had $17.7B of outflows in equities, the 5th straight week of outflows. Friday’s close saw NYSE new highs at 13 while new lows of 199 and the 10-day MA of New High/Low Differential is -110, crossing negative early last week. The percentage of SPX stocks above their 50-MA is at 20.4% while those above their 200-MA was 39.0%. NYSI and NASI Summation indexes are still below their 8-MA and in a short term sell signal. NYMO McClellan Oscillator closed at -72.7 after bouncing but still oversold. Cumulative AD line fell below the 40 EMA short term trend and also now under the 89 EMA long term signal. CBOE Equity P/C 50-day MA at 0.70 and falling. CNN Fear and Greed index is back in Extreme Fear zone at 25 from 20 last week. VIX/VXV ratio hit a high at 0.995 before closing at 0.93.