Weekly Market View 3-26-2023
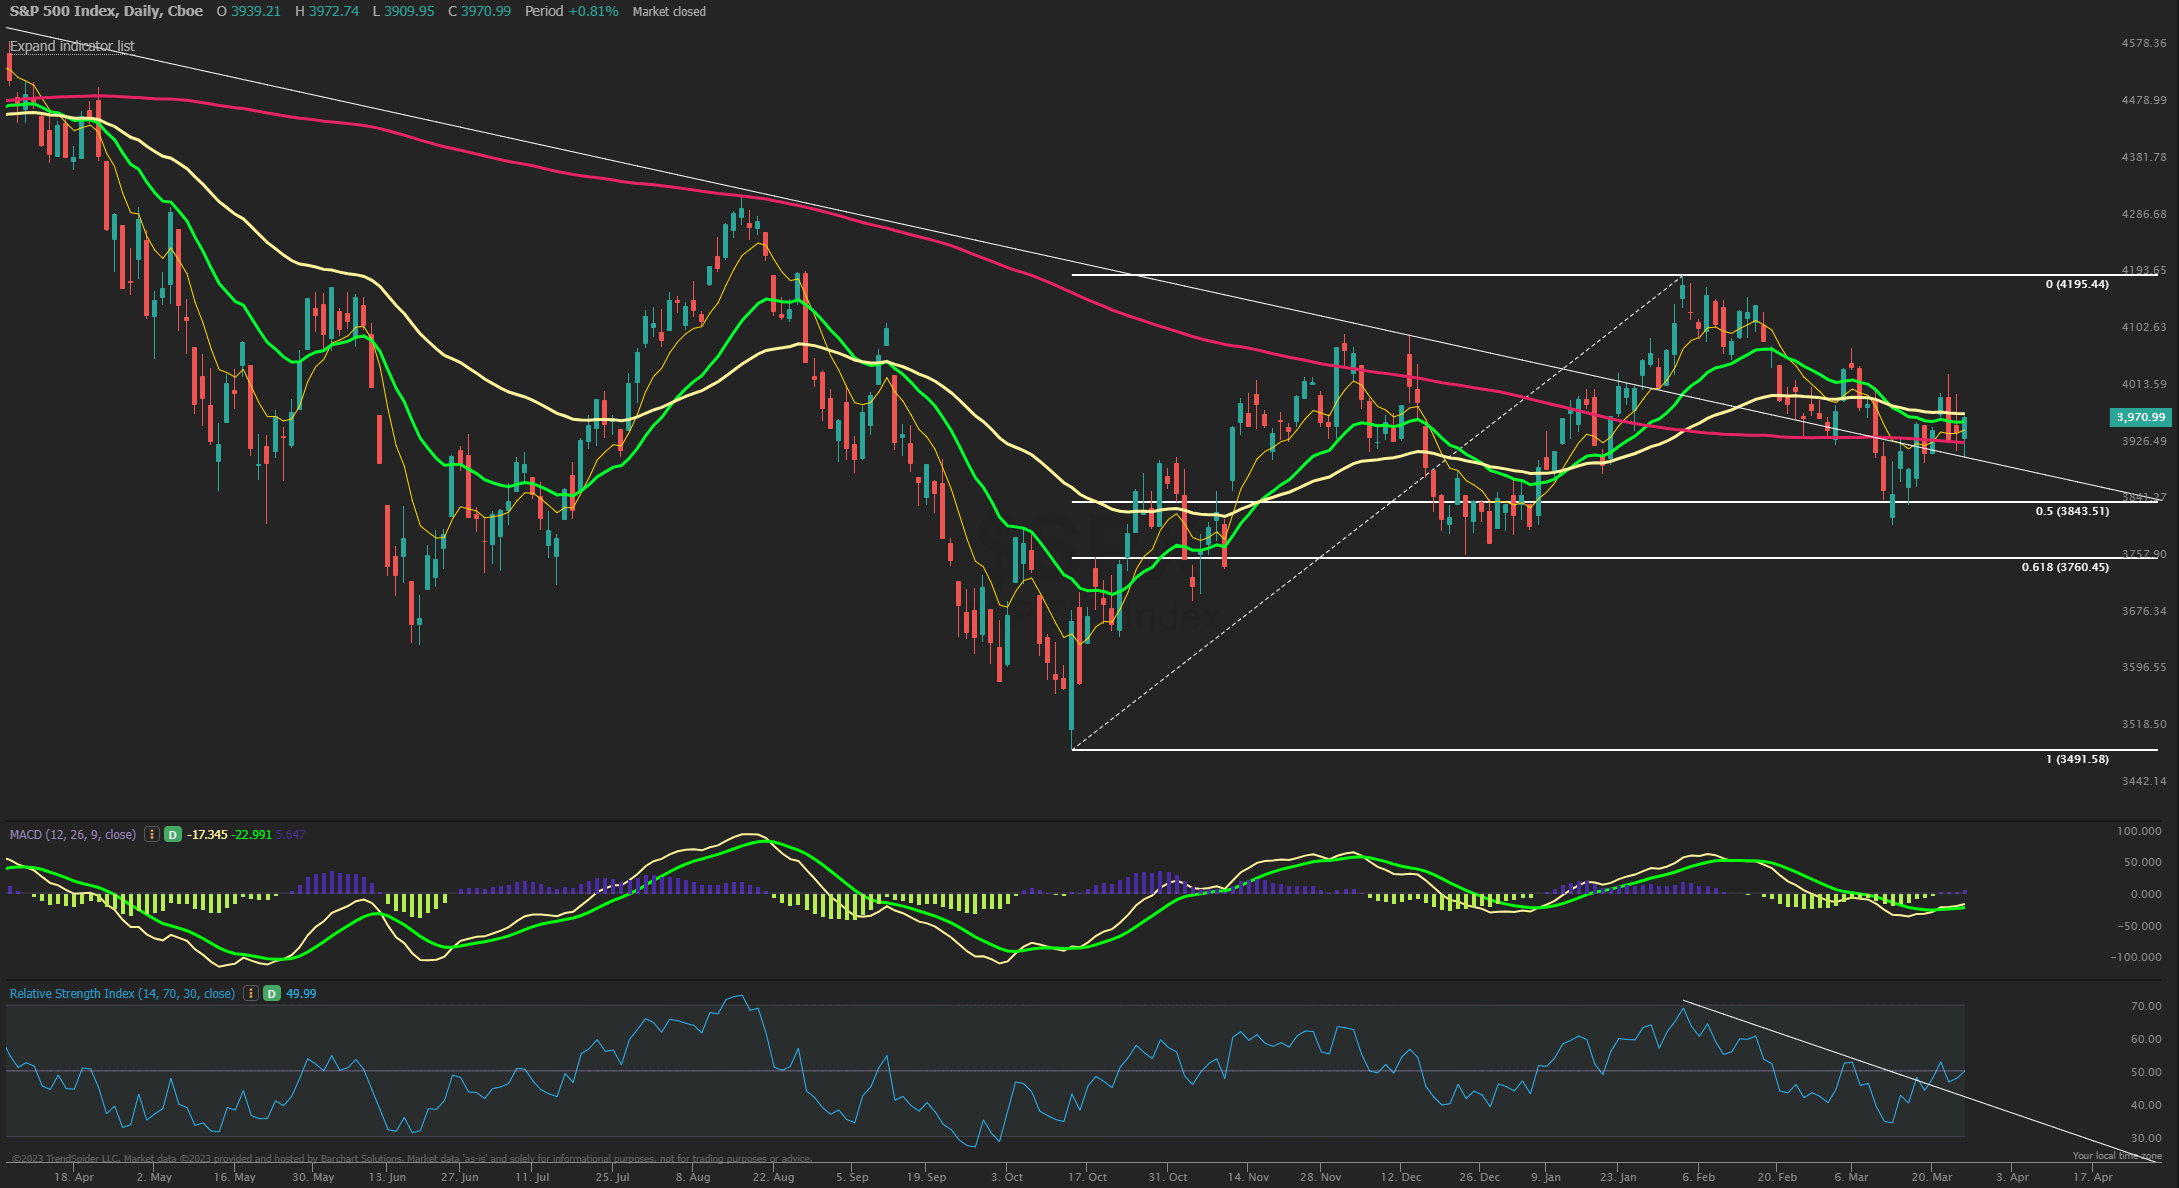
The SPX finished the week higher by +1.4% after a midweek reversal lower after FOMC was bought at key support near 3900 and closed Friday with a strong rally back to close just above the 21 day EMA which sits at 3965 now. The index is balanced in the high volume node near this 4000 magnet number with a week left into end of quarter and potential to see a choppy upside grind towards the larger resistance of 4065. With all the bad news out there, SPX has held firm impressively when it had every chance to breakdown. Fridays low also back tested the downtrend line from 2022 highs and the 200 day MA at 3925 also continues to hold now as the MACD crossed bullishly and RSI back near 50 and has broken above a trendline from the February highs which implied price may do the same soon. For now the SPX is stuck between key support of 3900 and strong resistance closer to 4075-4100.
AAII sentiment for the week ending 3/22 showed bullish responses rise slightly to 20.9% from 19.2% prior while bearish responses rose to 48.9% from 48.4%. Neutral sentiment fell to 30.2% from 32.4%. Optimism is at an unusually low level for the fifth consecutive week and the 45th time out of the past 64 weeks. Pessimism was last higher on December 22, 2022 (52.3%). The bull-bear spread (bullish minus bearish sentiment) rose by 1.2 percentage points to –27.9% but remains unusually low for the fifth consecutive week. The NAAIM Exposure index decreased to 53.21 from 41.92 but still at an overall low level and near last quarter’s average of 51.03. Lipper fund flows for the week ending 3/22 had $11.9B of inflows in equities, the first week of inflows in 6 weeks. Friday’s close saw NYSE new highs at 23 while new lows of 260 and the 10-day MA of New High/Low Differential is -164. The percentage of SPX stocks above their 50-MA is at 23.0% while those above their 200-MA was 42.8%. NYSI and NASI Summation indexes are still below their 8-MA and in a short term sell signal. NYMO McClellan Oscillator closed at -21 after bouncing back to near Neutral. The cumulative AD line is still below the 40 EMA short term trend and now under the 89 EMA long term signal. CBOE Equity P/C 50-day MA at 0.69 and falling. CNN Fear and Greed index is back in Fear zone at 33 from 24 last week. VIX/VXV ratio back down at 0.907 after recently hitting 1.00 levels often seen near bottoms.