How to Use Volume Weighted Average Price (VWAP)
Intro to VWAP
Volume Weighted Average Price (VWAP) is basically what it sounds like. The average price weighted by volume. The VWAP equals the dollar value of trading periods divided by the total trading volume for that current day. By paying attention to VWAP you can get an idea of where liquidity is and the price that buyers and sellers have agreed to be fair on that day. Similar to the recent post I did on Volume Profile and Value Areas, the VWAP indicator is often used by shorter term traders to identify intraday levels where prices may be drawn to or rejected from. Often there are also algo’s used to trade programs where large institutions are willing to place large orders at or around VWAP for the day, which makes the level very crucial as support or resistance.
The traditional way to calculate and use VWAP is on the intraday time frame where it is calculated from the open to the close. But other forms of VWAP can be used on a weekly or monthly rolling cumulative total or even an anchored VWAP which is started or “anchored” from a specific day, usually a key swing high or low on the price chart. These are all very useful for swing trading or longer term trend analysis. For the purposes of this introduction post to VWAP I will focus more on intraday examples.
How is VWAP calculated?
The formula for VWAP is simple since it’s a cumulative total of the price of each trade, multiplied by the volume of that trade, divided by the total volume that day. How it’s calculated really does not matter if you are going to use it as a tool in your trading, and you should because it’s very helpful. You can easily plot the indicator using any charting platform such as Thinkorswim. VWAP is displayed as a line just as a moving average typically looks. Most platforms will also plot a line above and below VWAP which are the 2 standard deviation levels from the actual VWAP. I tend to just use the pure volume weighted average price main plot because that is what I prefer but I also used an example below showing this version.
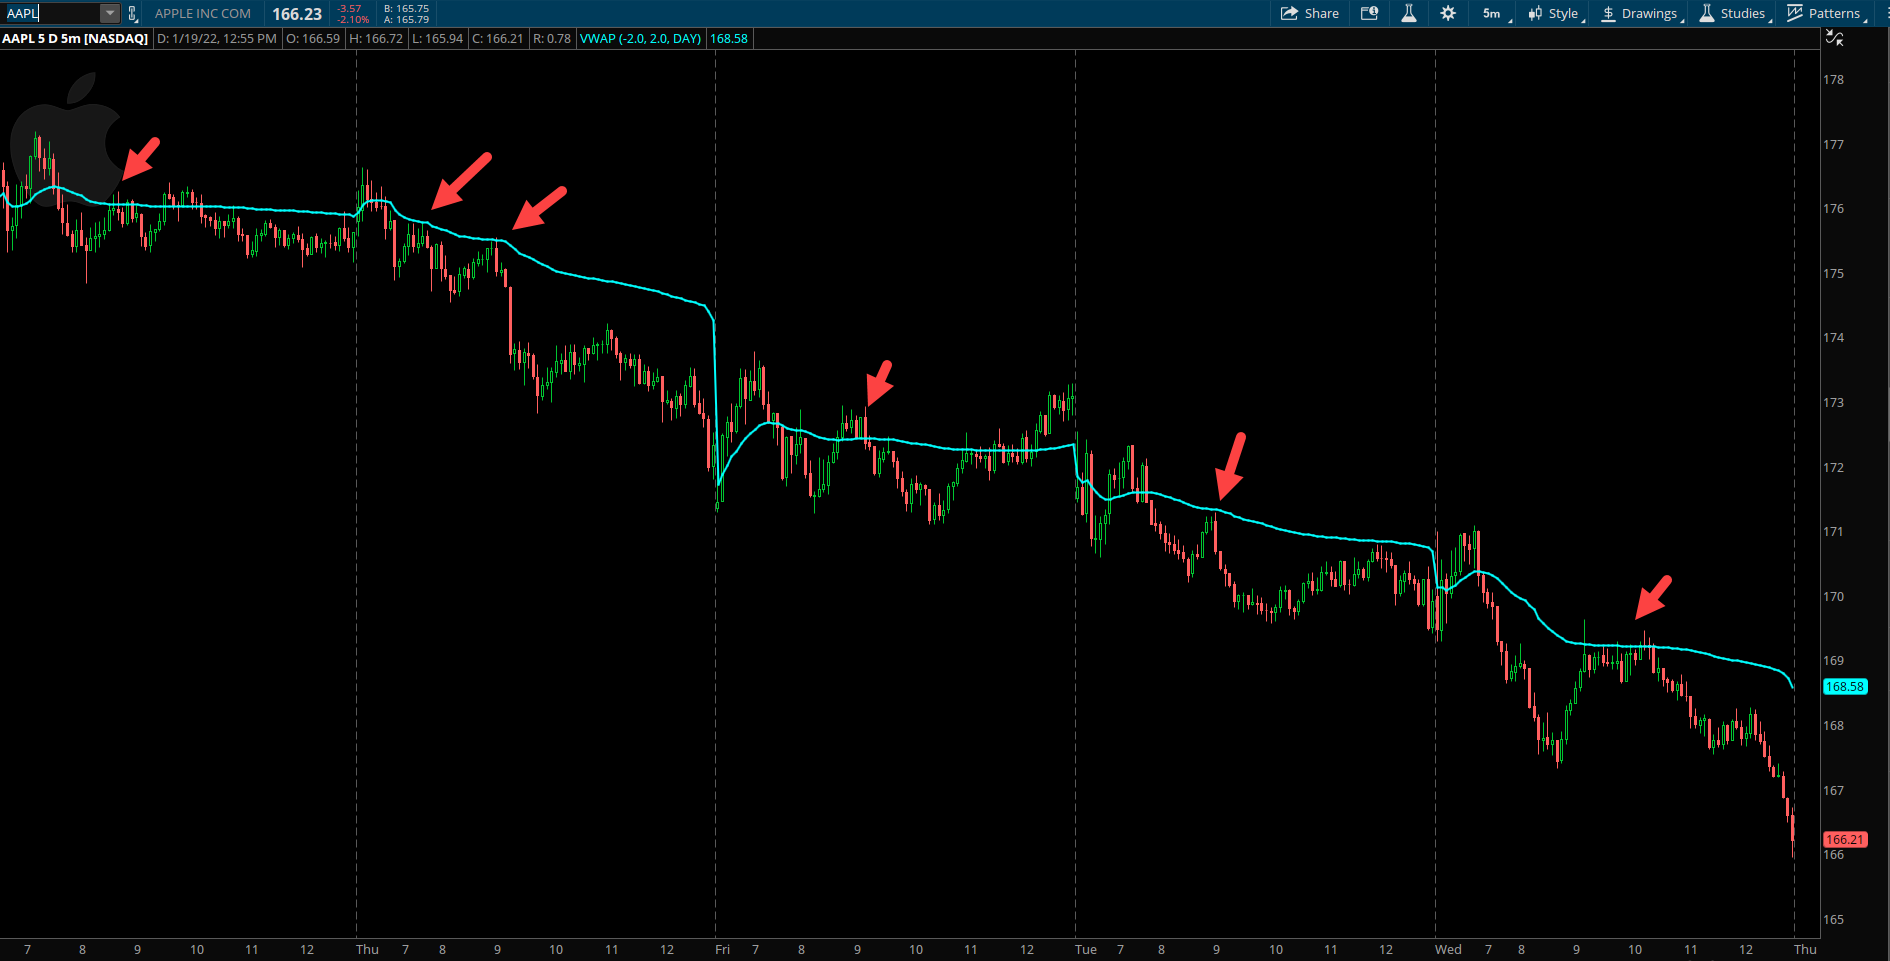
Similar to moving averages, VWAP is lagging since it is an average based on cumulative data from the past. But that doesn’t mean it’s not useful to stay on the right side of momentum in a trending market. Especially after the opening range forms in the market each morning, it’s good to see where VWAP is forming and how the trend of it looks as compared to where price action is moving. By comparing VWAP to where the stock’s current price is you get a good way to determine the direction of who is driving the price that day, buyers or sellers. VWAP will always be somewhere between the high and low price for the day. It’s very similar to a moving average since if the price is below VWAP then intraday prices are falling, and if above VWAP then intraday prices are rising. You can see in the AAPL example below using a 5 minute chart and daily VWAP how the price was quite sticky to that blue line of VWAP. The arrows show numerous occasions when AAPL stock was rejected off VWAP intraday and continued its downtrend.
How to Use VWAP in your Trading
VWAP is very helpful in understanding where liquidity exists for a market or stock. If the VWAP is simply the average price that day, weighted by volume it shows where the most “business” is taking place. The more interest there is at a specific price level then the more importance a trader can place on that level being a key line in sand for the time period traded. Stocks generally go through phases of trending and consolidation. Usually in a consolidating market going sideways the VWAP will also be mostly flat with little momentum. If prices get too far from VWAP they can have a tendency to eventually “revert back to the mean” sort of like a rubber band that becomes too stretched.
In the chart of TSLA below showing a 1 minute chart over two days of price action the VWAP starts day one with a strong trend up in the opening hour as TSLA rallies but then comes back to retest VWAP like a magnet at point 1. On a strong day with clear upside bias this is usually a good short term buy level to expect the price to rebound off VWAP and head higher. It was good for 5-10 points on this day in TSLA but as price stayed mostly muted by midday, VWAP turned sideways and the price action struggled to get too much beyond VWAP until the last hour when it decisively breaks below and trends down into the close. The next day at point 2, TSLA gaps higher but struggles to stay above VWAP in the opening 30 minutes which is a clue it’s likely headed lower into a gap fill and maybe further. After filling the gap you can see it attempted to bounce back to VWAP but could not even reach the blue line. It then cascades lower towards the 1000 price level where it tries to rebound from and then the target is VWAP overhead at point 3. As you can see price rarely gets too far from VWAP without reverting back to its mean, or average volume price. Once TSLA reached VWAP back at 1020 roughly it chopped around but was unable to gain any upside momentum beyond this spot. VWAP also stayed flat showing not much change in trend, this resulted in the stock rolling back over to finish at the lows for the day below VWAP.

Sometimes VWAP is support for the day and sometimes its resistance, it all depends on the market price action for the day. VWAP can often be a target for a counter trend trade setup as well. It’s up to the trader to use it according to their trade plan. In a market that is weaker and selling off from the open, then shorting moves below VWAP is a way to stay on the right side of intraday momentum. As the chart of QQQ shows below on this day, the ETF opened higher and bounced off VWAP a few times in the opening hour. Once it clearly broke below at point 1, it was a sell signal as price action was changing its character. If it was strong it would have stayed above VWAP and went to new highs. It then sold off for the next hour much lower before finding some footing and rebounding right around the time Europe markets closed. If you bought near the lows looking for a bounce, using the VWAP as a target to exit long trades would have been very helpful as price did not rally much past that level for the rest of the day. Infact, at point 2 it later cracked back below VWAP and that was another sell signal to look for lower prices into the close as long as VWAP was not breached to the upside.

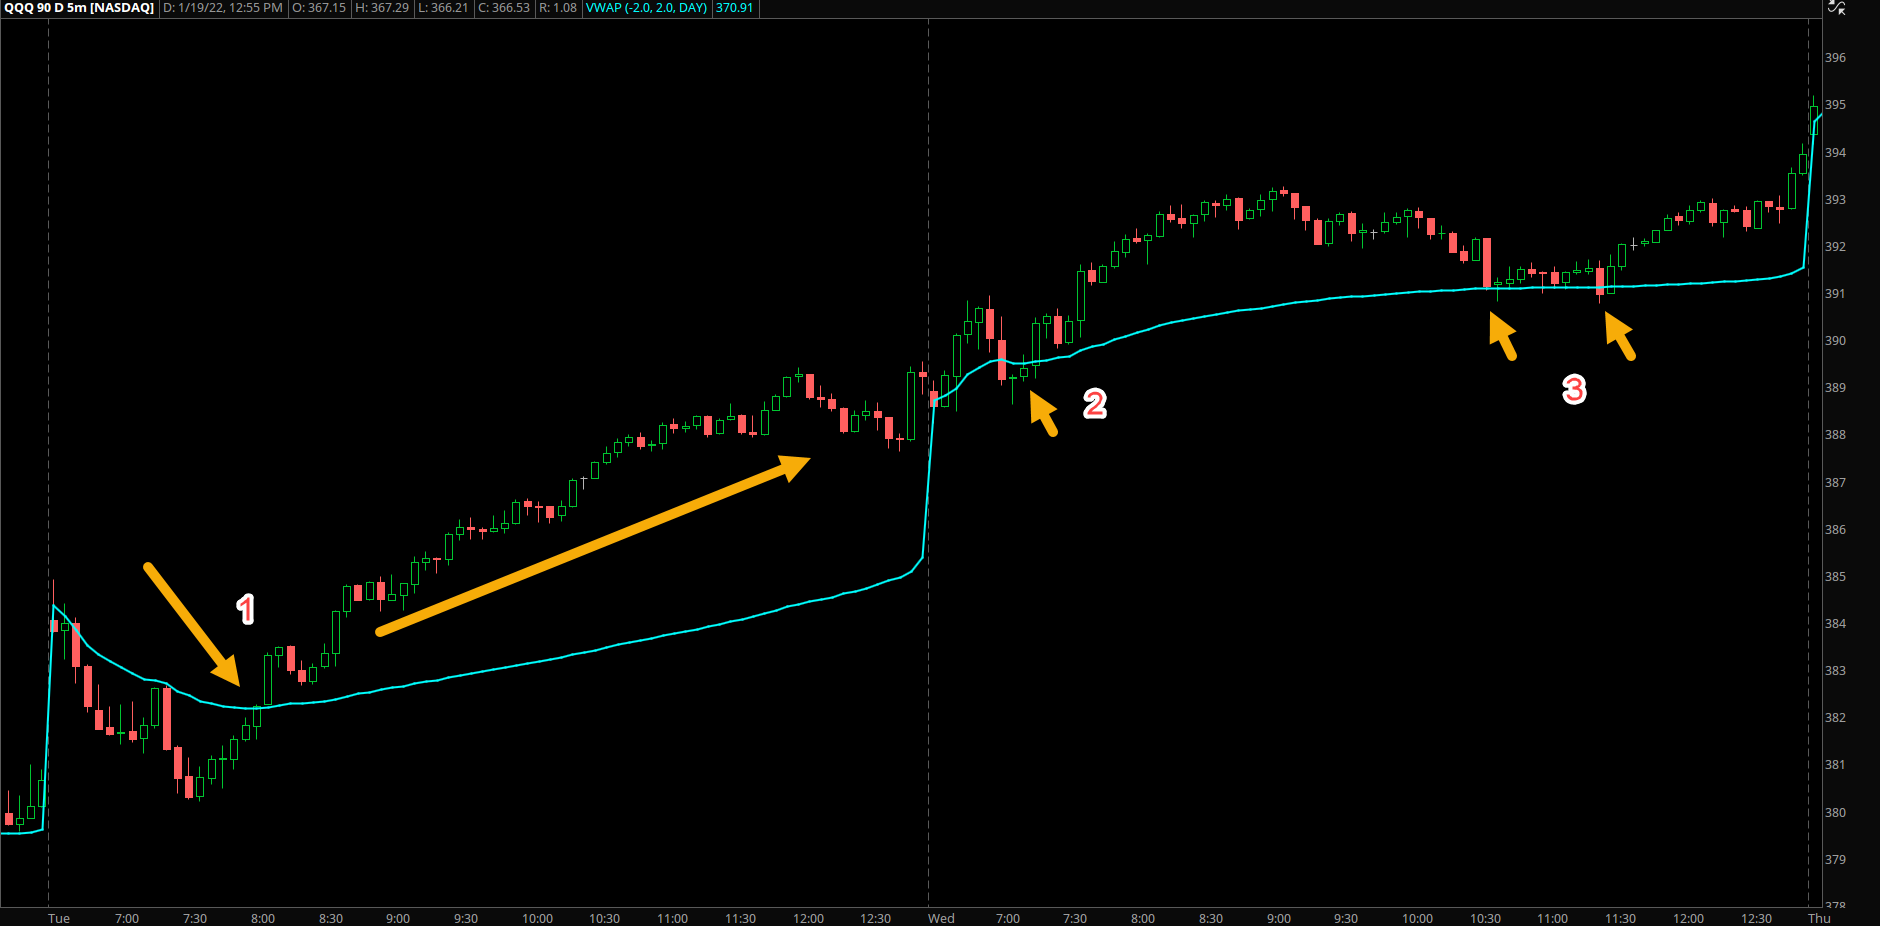
Similar to a downtrending stock, you can get great signals with stronger stocks on days the market is trending up. One of my favorite ways to use VWAP is to look for intraday trend shifts. If the first hour or two is decidedly one direction and then price gets above VWAP and closes above for 15 minutes or so then that’s a strong sign that price is changing trend for the day. In the example below on the QQQ 5 minute chart, the stock started the day weaker by fading lower to fill its gap. Then at point 1 after about 90 minutes of the market being opened, the price had a strong surge back over VWAP and closed above it decisively. If you are simultaneously looking at market breadth internals and other key factors at this point you would likely have confidence to get bullish and expect prices to rally higher as long as above VWAP. That day did exactly that. A clean trend up day that closed on the highs without ever retesting VWAP.
The next day at point 2, the QQQ started off stronger again and retested VWAP in the first hour which is where buyers came in to push prices higher. Later in the day at point 3, the QQQ again tested VWAP a few times and bounced nicely back to close at the highs of the day. Focusing on 1-2 trades per day that are high probability at key levels is really all it takes most of the time if you are a short term trader. Using VWAP as your guide path and overall trend bias for the day can be extremely useful once you understand how price respects the volume weighted average price.
Takeaways:
- The VWAP equals the dollar value of trading periods divided by the total trading volume for that current day.
- Understanding the trend of the VWAP each day can tell a trader if the market is trending or likely to have sideways choppy price action.
- Prices below VWAP for that day are relatively low for that day, and prices above VWAP are relatively high for that day.
- Prices tend to revert back to VWAP once they become too extended away from it, the rubber band effect.
- In an uptrend, pullbacks to the VWAP intraday can be treated as buying opportunities as funds will also use this level as spots for their buy programs.